


 인쇄
인쇄


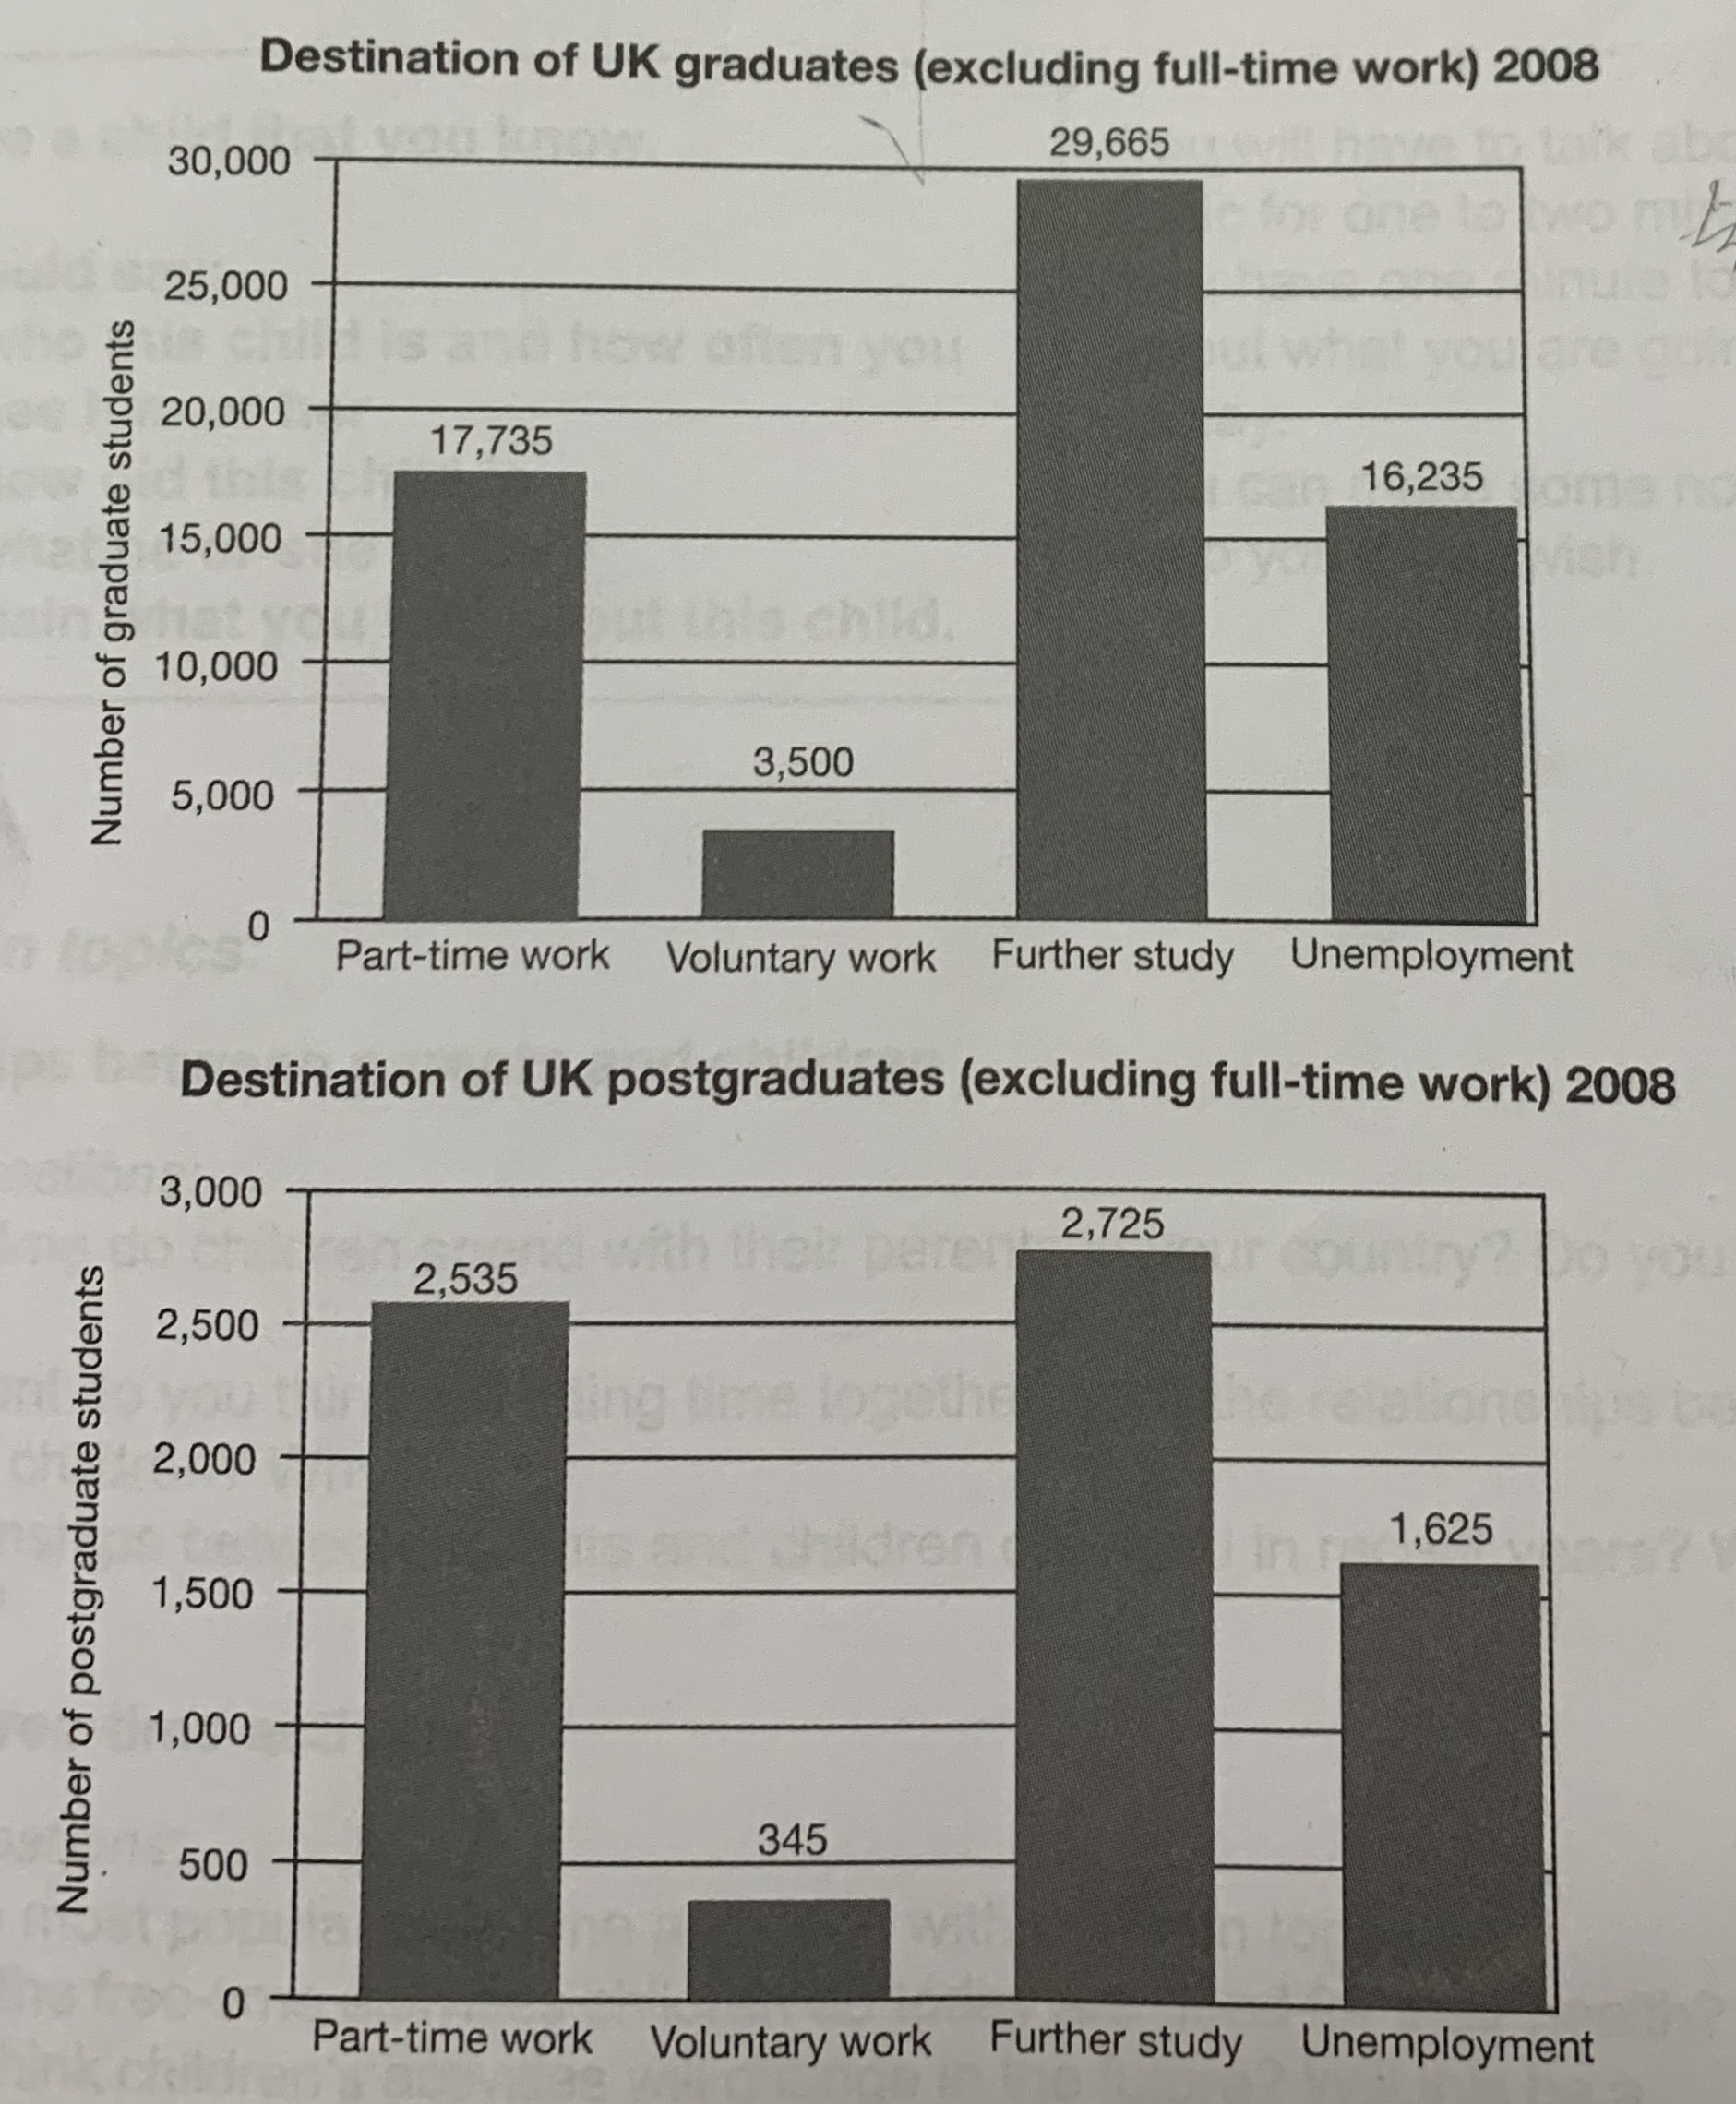
The given bar graphs give information about the different status of the British graduates and postgraduates after leaving college excluding full time employees in 2008.;categorized Further study,Part-time work, Unemployment,and Voluntary work.
It is clear that the number of bachelor’s students is much more than that of master’s students. However, the two charts show somewhat different results between the two groups. (여기서 실제로 어떻게 다른지 '대략은' 서술할 수 있어야 합니다.)
First of all, in both groups, the most number of the students pursued further studies, respectively 29,665 and 2,765. The second most popular numbered (이 표는 인기도와 아무런 상관이 없습니다. 일례로, 실업 상태의 사람들이 원해서 실업인 경우는 웬만하면 없겠죠.) decision to do after graduation was part time work,followed by unemployment which was the third most common choice in both groups. Interestingly, there is less difference in figures between part-time work and unemployment in the first chart than the second chart. (분석으로 아주 좋습니다.) In other words, a similar number of graduate students made a choice to do part-time work and unemployment after finishing university. At the end, both student groups didn’t (줄임말은 풀어써주셔야 합니다.) fairly choose voluntary work as doing after graduation. The numbers are 3,500 and 345, respectively.
총평: (6/5/6/6) 6.0
이번 글의 경우도 제가 엔터를 두 번 쳐드렸으니 참고해서 다음 글부터는 꼭 엔터를 정확히 쳐주시면 되겠습니다. 점수에 들어가니까 주의해주세요!
또한 표가 두 개 나오는 경우는 문단을 나눠주시는 게 좋아요. 즉 여기의 경우 서론-Overview-학부-석사로 구분해서 적는 게 좋습니다. 이때 석사를 다루는 문단에서 학부와의 차이점까지 엮어서 분석해주시면 되고요. 이렇게 구조를 잡는 게 훨씬 수월할 겁니다.
수고하셨습니다 :)

 비밀번호 확인
 댓글 0개
댓글 0개


 불편사항 신고