


 인쇄
인쇄


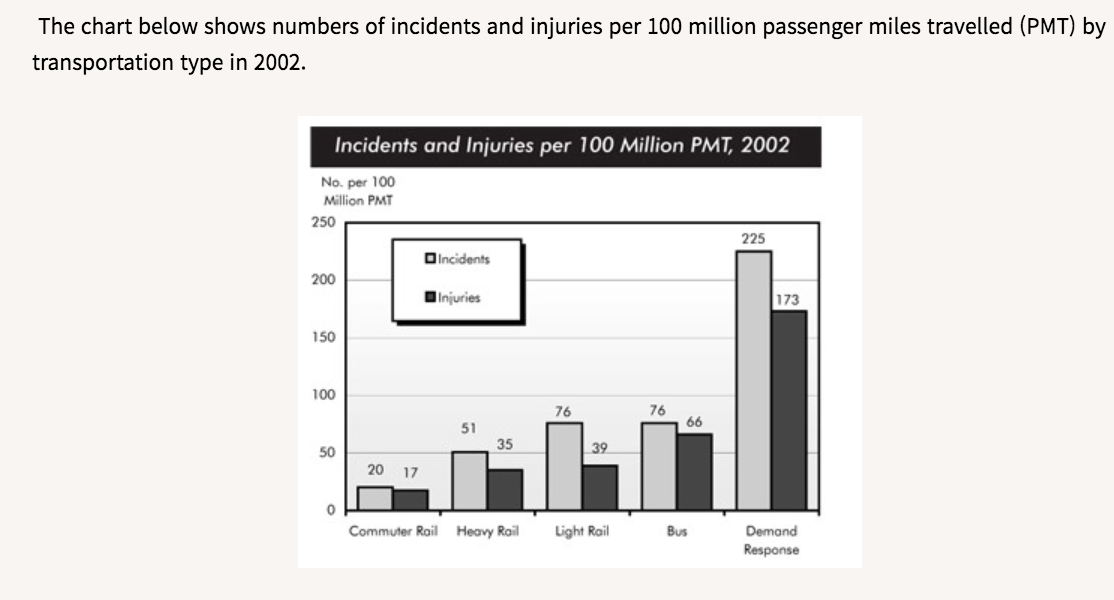
The given bar graph describes statistical information about the incidents and injuries per 100 million passenger miles travelled by the five distinct types of transportation in 2002.
Overall it seems that the figure of accidents and injuries of demand response was overwhelmingly high among the given chart. All types of transportations had a higher number of incidents than injuries.
Looking at the graph more closely, one can see that a demand response transportation, such as taxi, reached the highest number, which is the only one that surpassed 200 and 100, in incidents and injuries respectively. When comparing a heavy and a light rail, the light rail had slightly higher statistic in both incidents and injuries, interestingly they shared similar numbers in injuries. It is noticeable that buses recorded the second-highest number in injuries, by 66 per 100 million PMT, while the number of incidents was the same as the light rail. It is noteworthy that the commuting rail has a relatively low rate of accidents and people who injured.
wc: 169
시간: 15분+ 2분검토

 댓글 0개
댓글 0개


 불편사항 신고