


 인쇄
인쇄


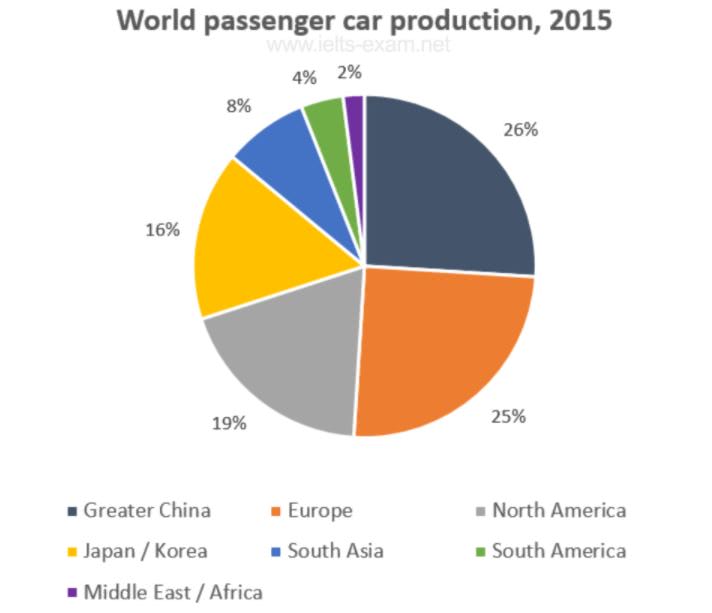
The graph gives information about the world passenger car
production in 2015. Overall, it is divided into 7 categories, which include
three countries and six continents. (항목이 어떻게 이루어져있는지 적는 건 의미가 없고, 표 내용의 전반적인 특징을 적어주셔야 합니다.)
What stands out is
that the regions of Greater China and Europe lead the way in terms of the
manufacture of passenger cars. First of all, the highest portion of this pie chart was taken by China, which it accounted for 26%. It was followed by Europe, which was 25%. Then, North
America was in a third place on the given chart. The percentage of Japan/Korea
was 16%, which was marginally smaller than North America’s figure.
The figure of the other three categories were quite small
compared to previous ones. The remaining all three categories were below than
10%. In South Asia, passenger car was manufactured rarely, it was only 8%. The percentage
of the South America was 4%. The the group that produced the least cars was Middle
East/ Africa, it only accounted for 20% (이거 하나 틀린다고 폭풍감점되는 건 아니지만, 그래도 가급적이면 숫자는 정확하게 적어주세요!).
글자수: 159
시간: 19분
목표 7
총평: (6/7/7/7) 7.0
자잘한 오류가 조금 있긴 하지만, 그래도 저는 자신감 증진을 위해 점수를 최대한으로 매겼습니다. 대신, Overview만 정확하게 적어주셨으면 보다 확실한 7.0이 보장된다고 말씀드릴 수 있을 것 같아요. Overview에서 절대로 저렇게 항목에 대한 갯수 설명만 하고 넘기지 않도록 해주세요!
수고하셨습니다 :)

 비밀번호 확인
 댓글 0개
댓글 0개


 불편사항 신고