


 인쇄
인쇄


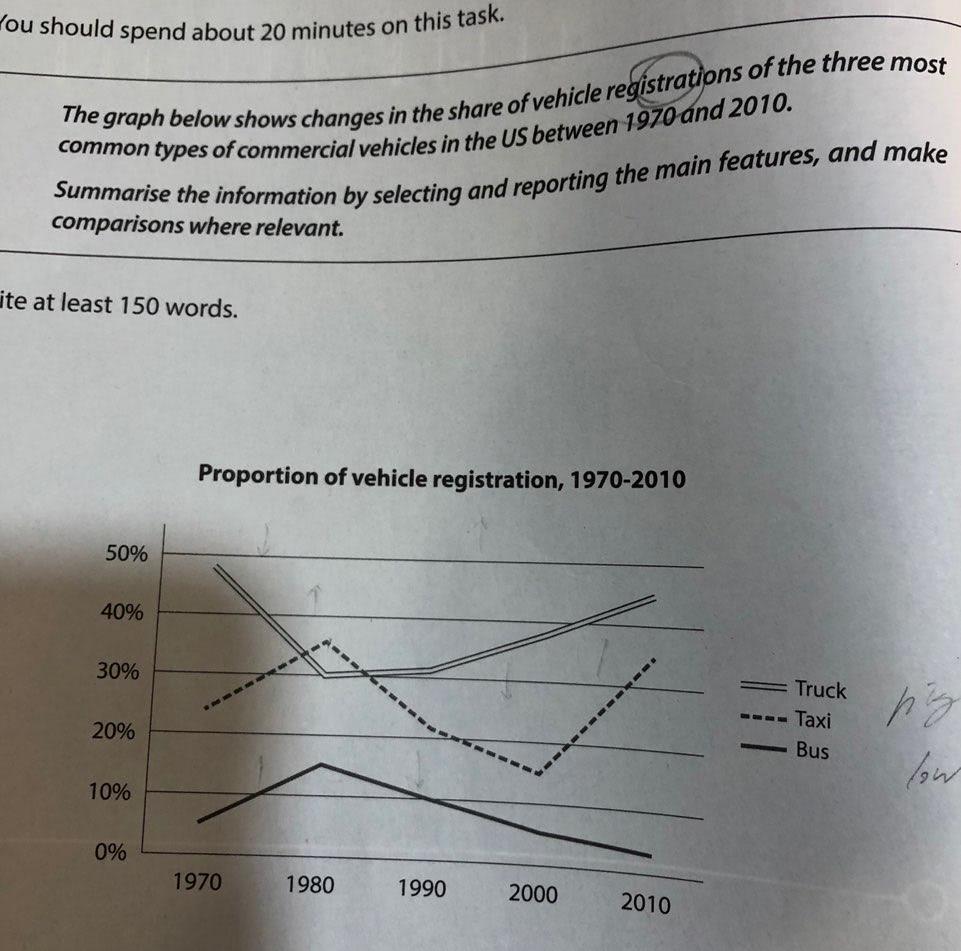
The line graph shows the figures of the three most types vehicle that in the US from 1970 to 2010
Overall, it is clear that the rates of taxi have experienced up and down over the period. The percentage of bus grew first 10 years, but after then, it dropped until 2010. In contrast, the proportion of truck decreased initially, but, since 1980, it had rosed steadily.
Looking at the graph more closely, one can observe that the rates of taxi increased from about 23 percent in 1970 to 35 percent by1980, but, between 1980 and 2000, it dropped approximately 20 percent, hitting a low of 15 percent. However, since then, it surged to 35 percent in 2010. In the case of bus, it increased about 10 percent over a decade period, so it reached at 15 percent, but, after that period, it declined until 2010, with the 3 percent. In contrast, the percentage of truck decreased first 10 year, with 30 percent in 1980, but it rosed continually between 1980 and 2010, reaching at 44 percent in 2010.

 댓글 0개
댓글 0개


 불편사항 신고