


 인쇄
인쇄


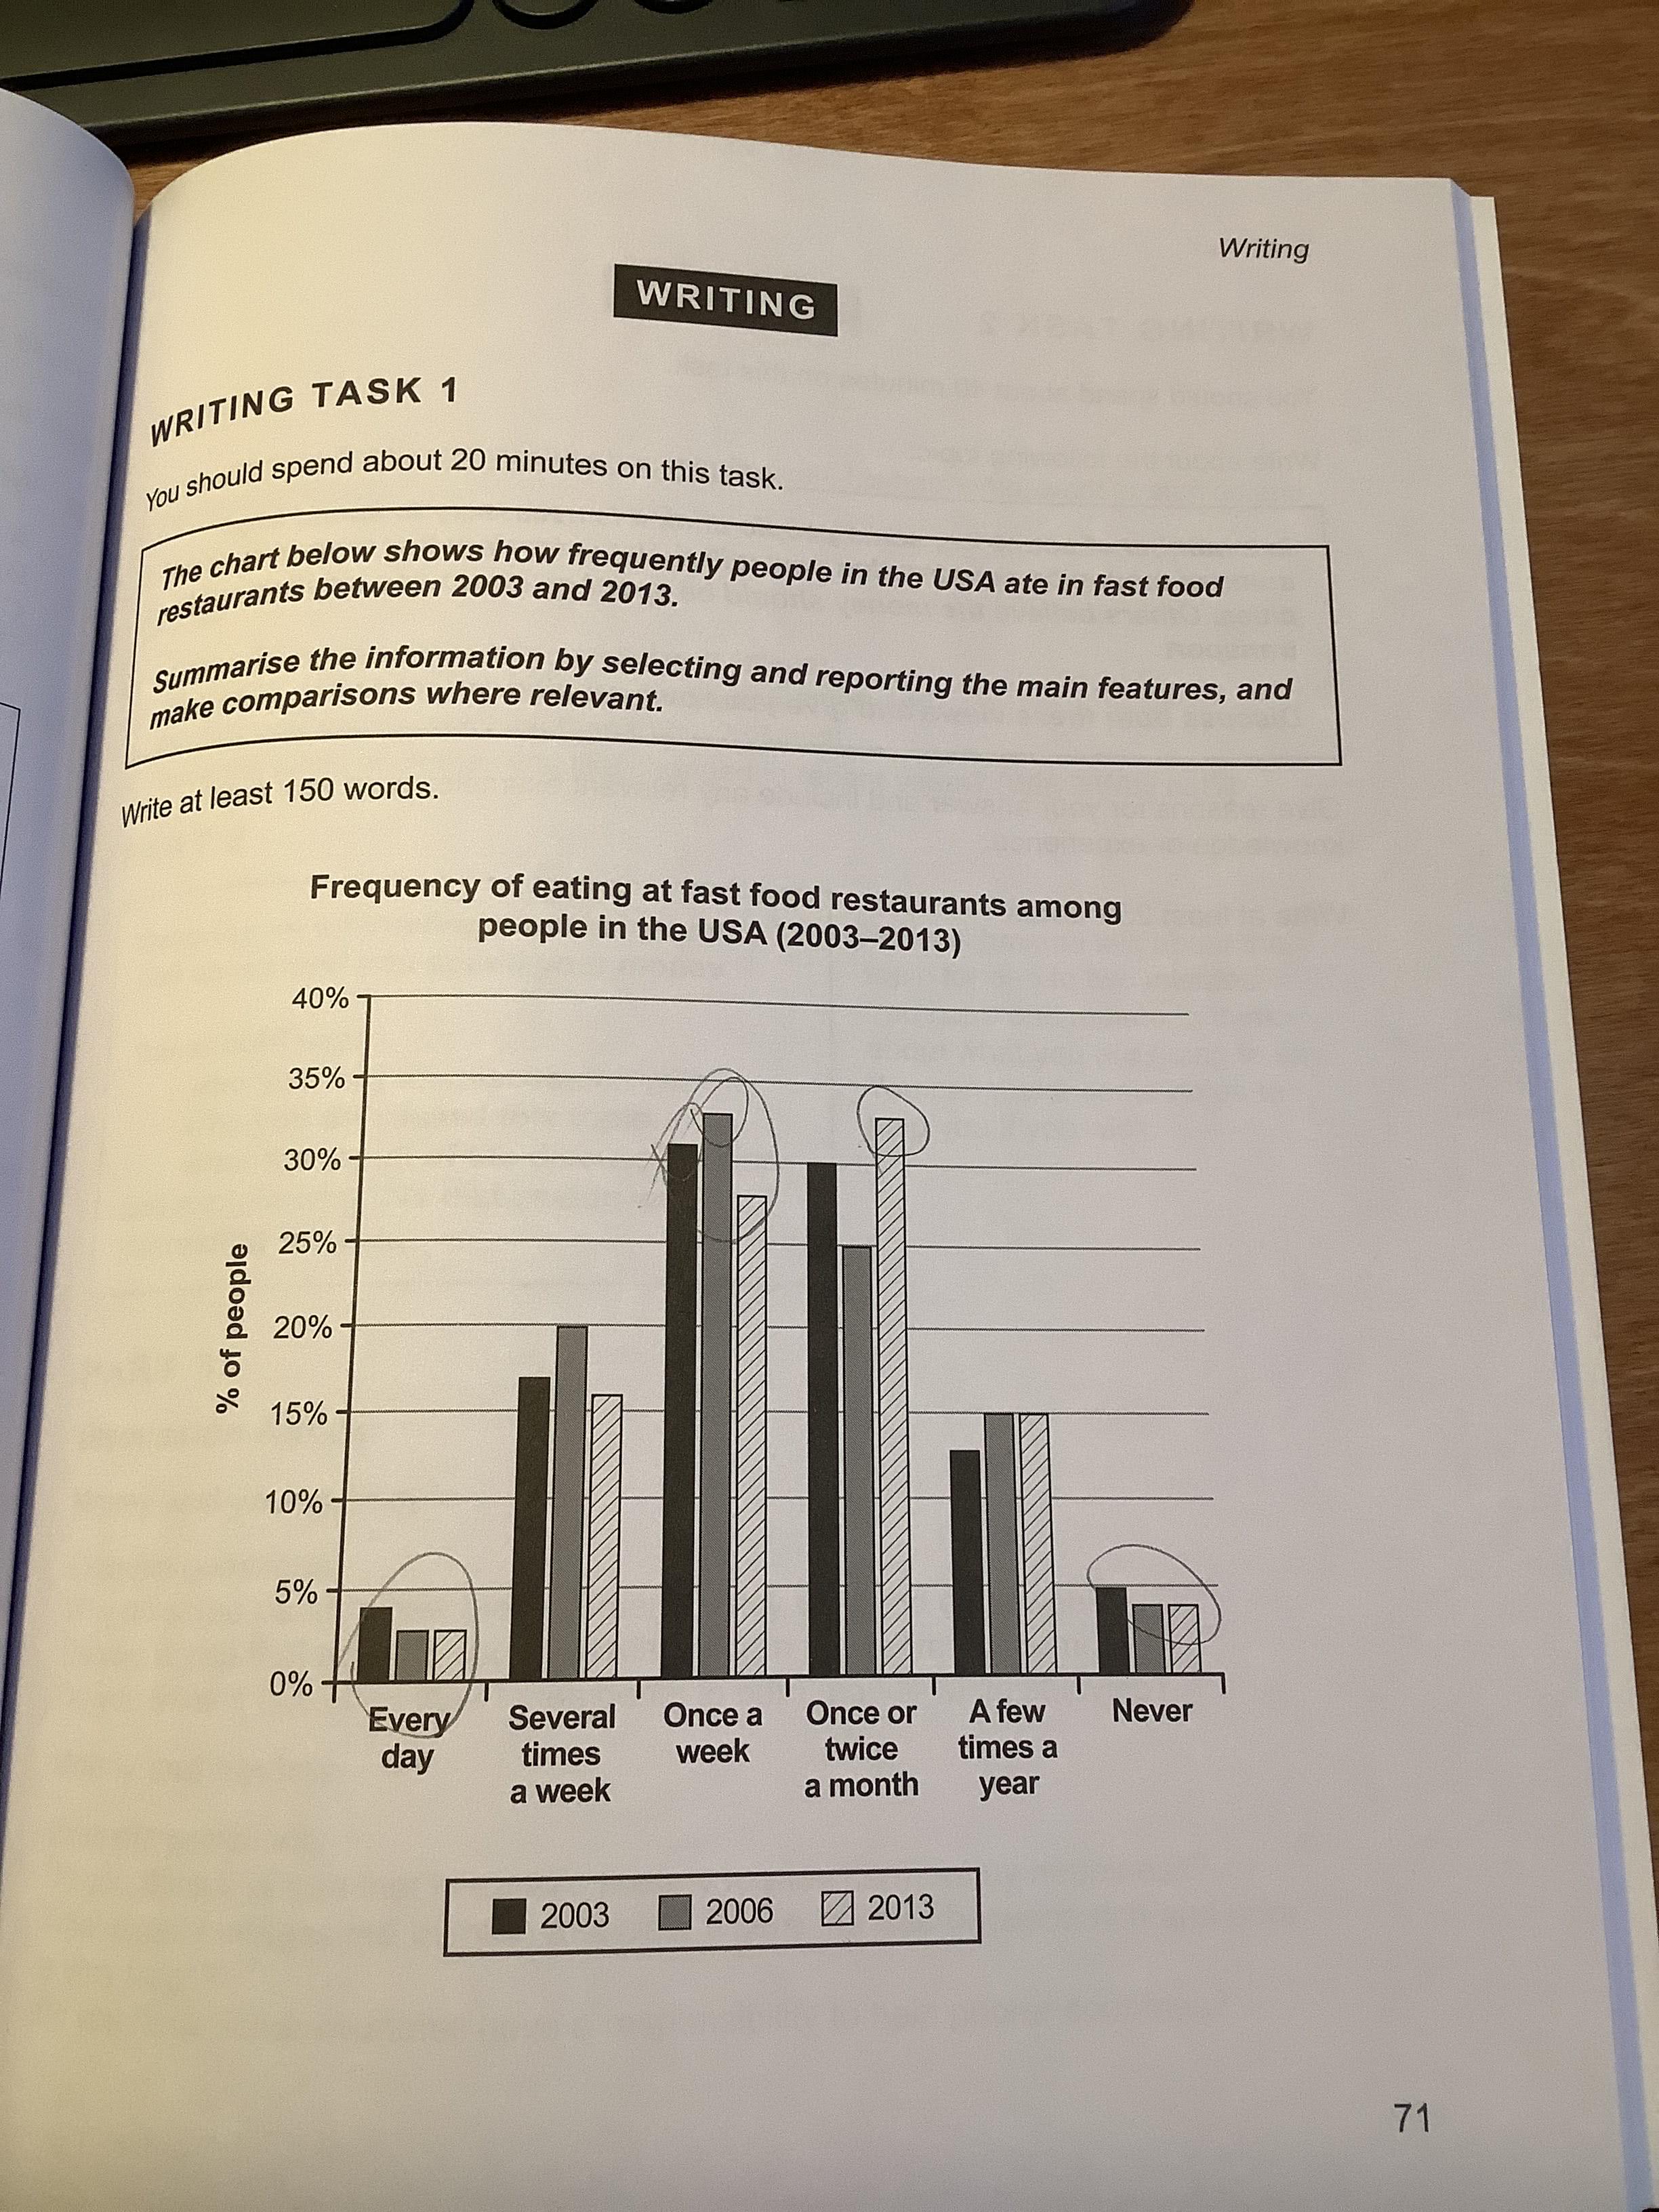
The given chart represents that the percentage of people that how often people they have meals in fast food restaurants in the USA from 2003 to 2013. Overall, people who go to fast food restaurant once a week account for above 25% while the percentage of people who go there everyday is under 5%. (Overview에서는 구체적인 수치가 따로 들어가지 않습니다.)
First, the most notable feature is the fact that the biggest portion is shown in that the percentage of people who have meals in a fast food restaurant once a week and once or twice a month. The percentage of the category about once or twice a month which is 30% in 2006 decreased to by 25% in 2006 and hit the peak of over 35% in 2013 while the rates of several times a week and once a week dropped by about 15% and 27% respectively from 2006 to 2013.
On the other hand, less than 5% of people used a fast food restaurant everyday in the period likewise the proportion of people who never went go to the restaurant kept keep 5% in 2003 and even more decreased in 2006 and remained the data. The category about a few times a year maintained the percentage as 15% in 2006 and 2013.
총평: (6/5/6/5) 5.5
이번 글의 경우 표현상 어색한 면들이 꽤 있는 편입니다. 또한 굳이 이번 글로 한정짓지 않더라도, 전반적으로 문법이 아~주 깔끔한 거라고 말할 수는 없는 상황이므로, 6.5 이상이 안정적으로 필요하시면 꼭 글을 쓰는 것과는 별개로 문법에 대한 공부 역시 해주세요! 제가 바꿔드린 건 어차피 유일한 정답도 아니며, 애초에 제가 놓친 부분도 있을 것이므로 Dd님께서 스스로 어느정도의 정확성을 확보할 수 있도록 문법 학습을 해주시는 게 필요합니다.
수고하셨습니다 :)

 비밀번호 확인
 댓글 0개
댓글 0개


 불편사항 신고