


 인쇄
인쇄


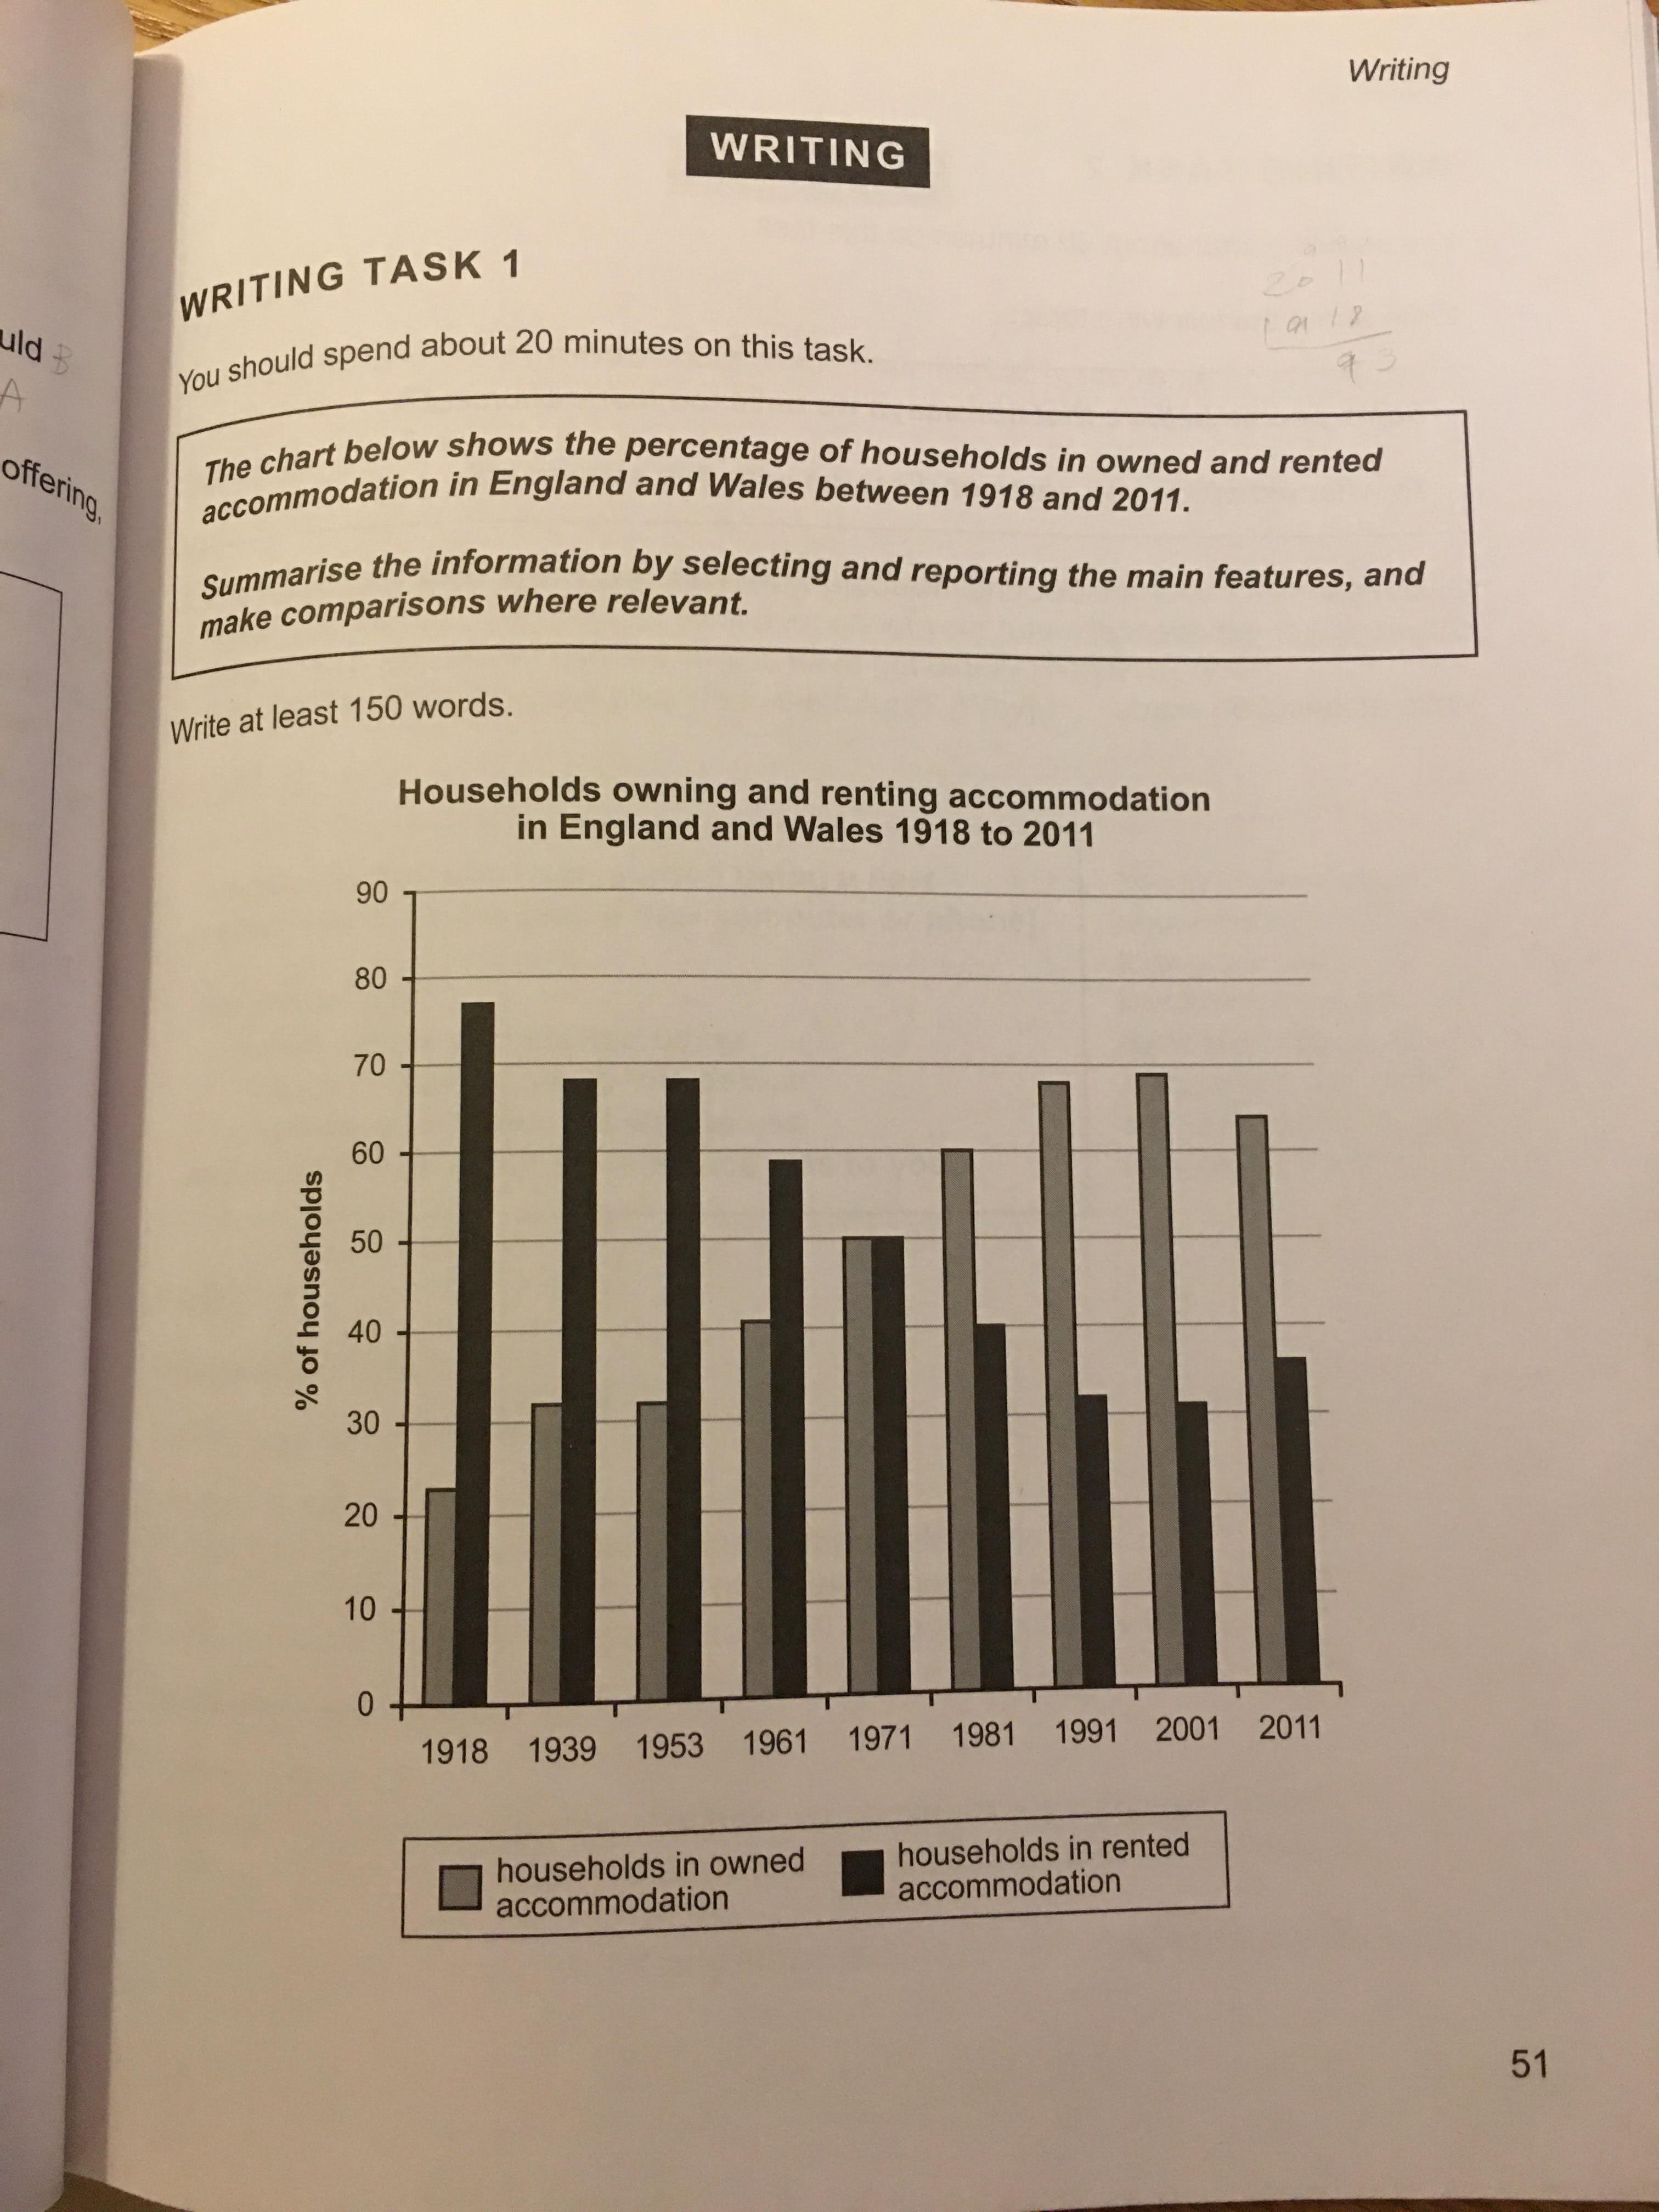
The bar graph illustrates households that owned and rented accommodation in England and Wales from 1918 to 2011 as a percentage.
Overall, the most noticeable feature from the chart is that each category experienced reversed trends as the percentage of owned accommodation shows an upward trend while the proportion of rented accommodation depicts a downward trend.
Looking at the data more closely, one can see that the percentage for households in rented accommodation gradually decreased over the 93-year period except for the years 1939 and 1953 where the numbers of percentage remained the same at approximately 68 percent and the period of 2011 as the proportion of rented accommodation increased from 31 percent in 2001 to 35 percent in 2011. In contrast, the percentage of households in owned places demonstrates steady growth between 1918 and 2011 except for the same period that rented accommodation experienced no change and an increase. While the percentage of households that owned properties accounted for only 32 percent both years 1939 and 1953, this number reached its peak in 2001 at around 69 percent before slightly dropping to 63 percent. In addition, in 1971, the proportions of both types of accommodations were equal at 50 percent.
소요시간: 20분
목표 점수: 7.0

 댓글 0개
댓글 0개


 불편사항 신고