


 인쇄
인쇄


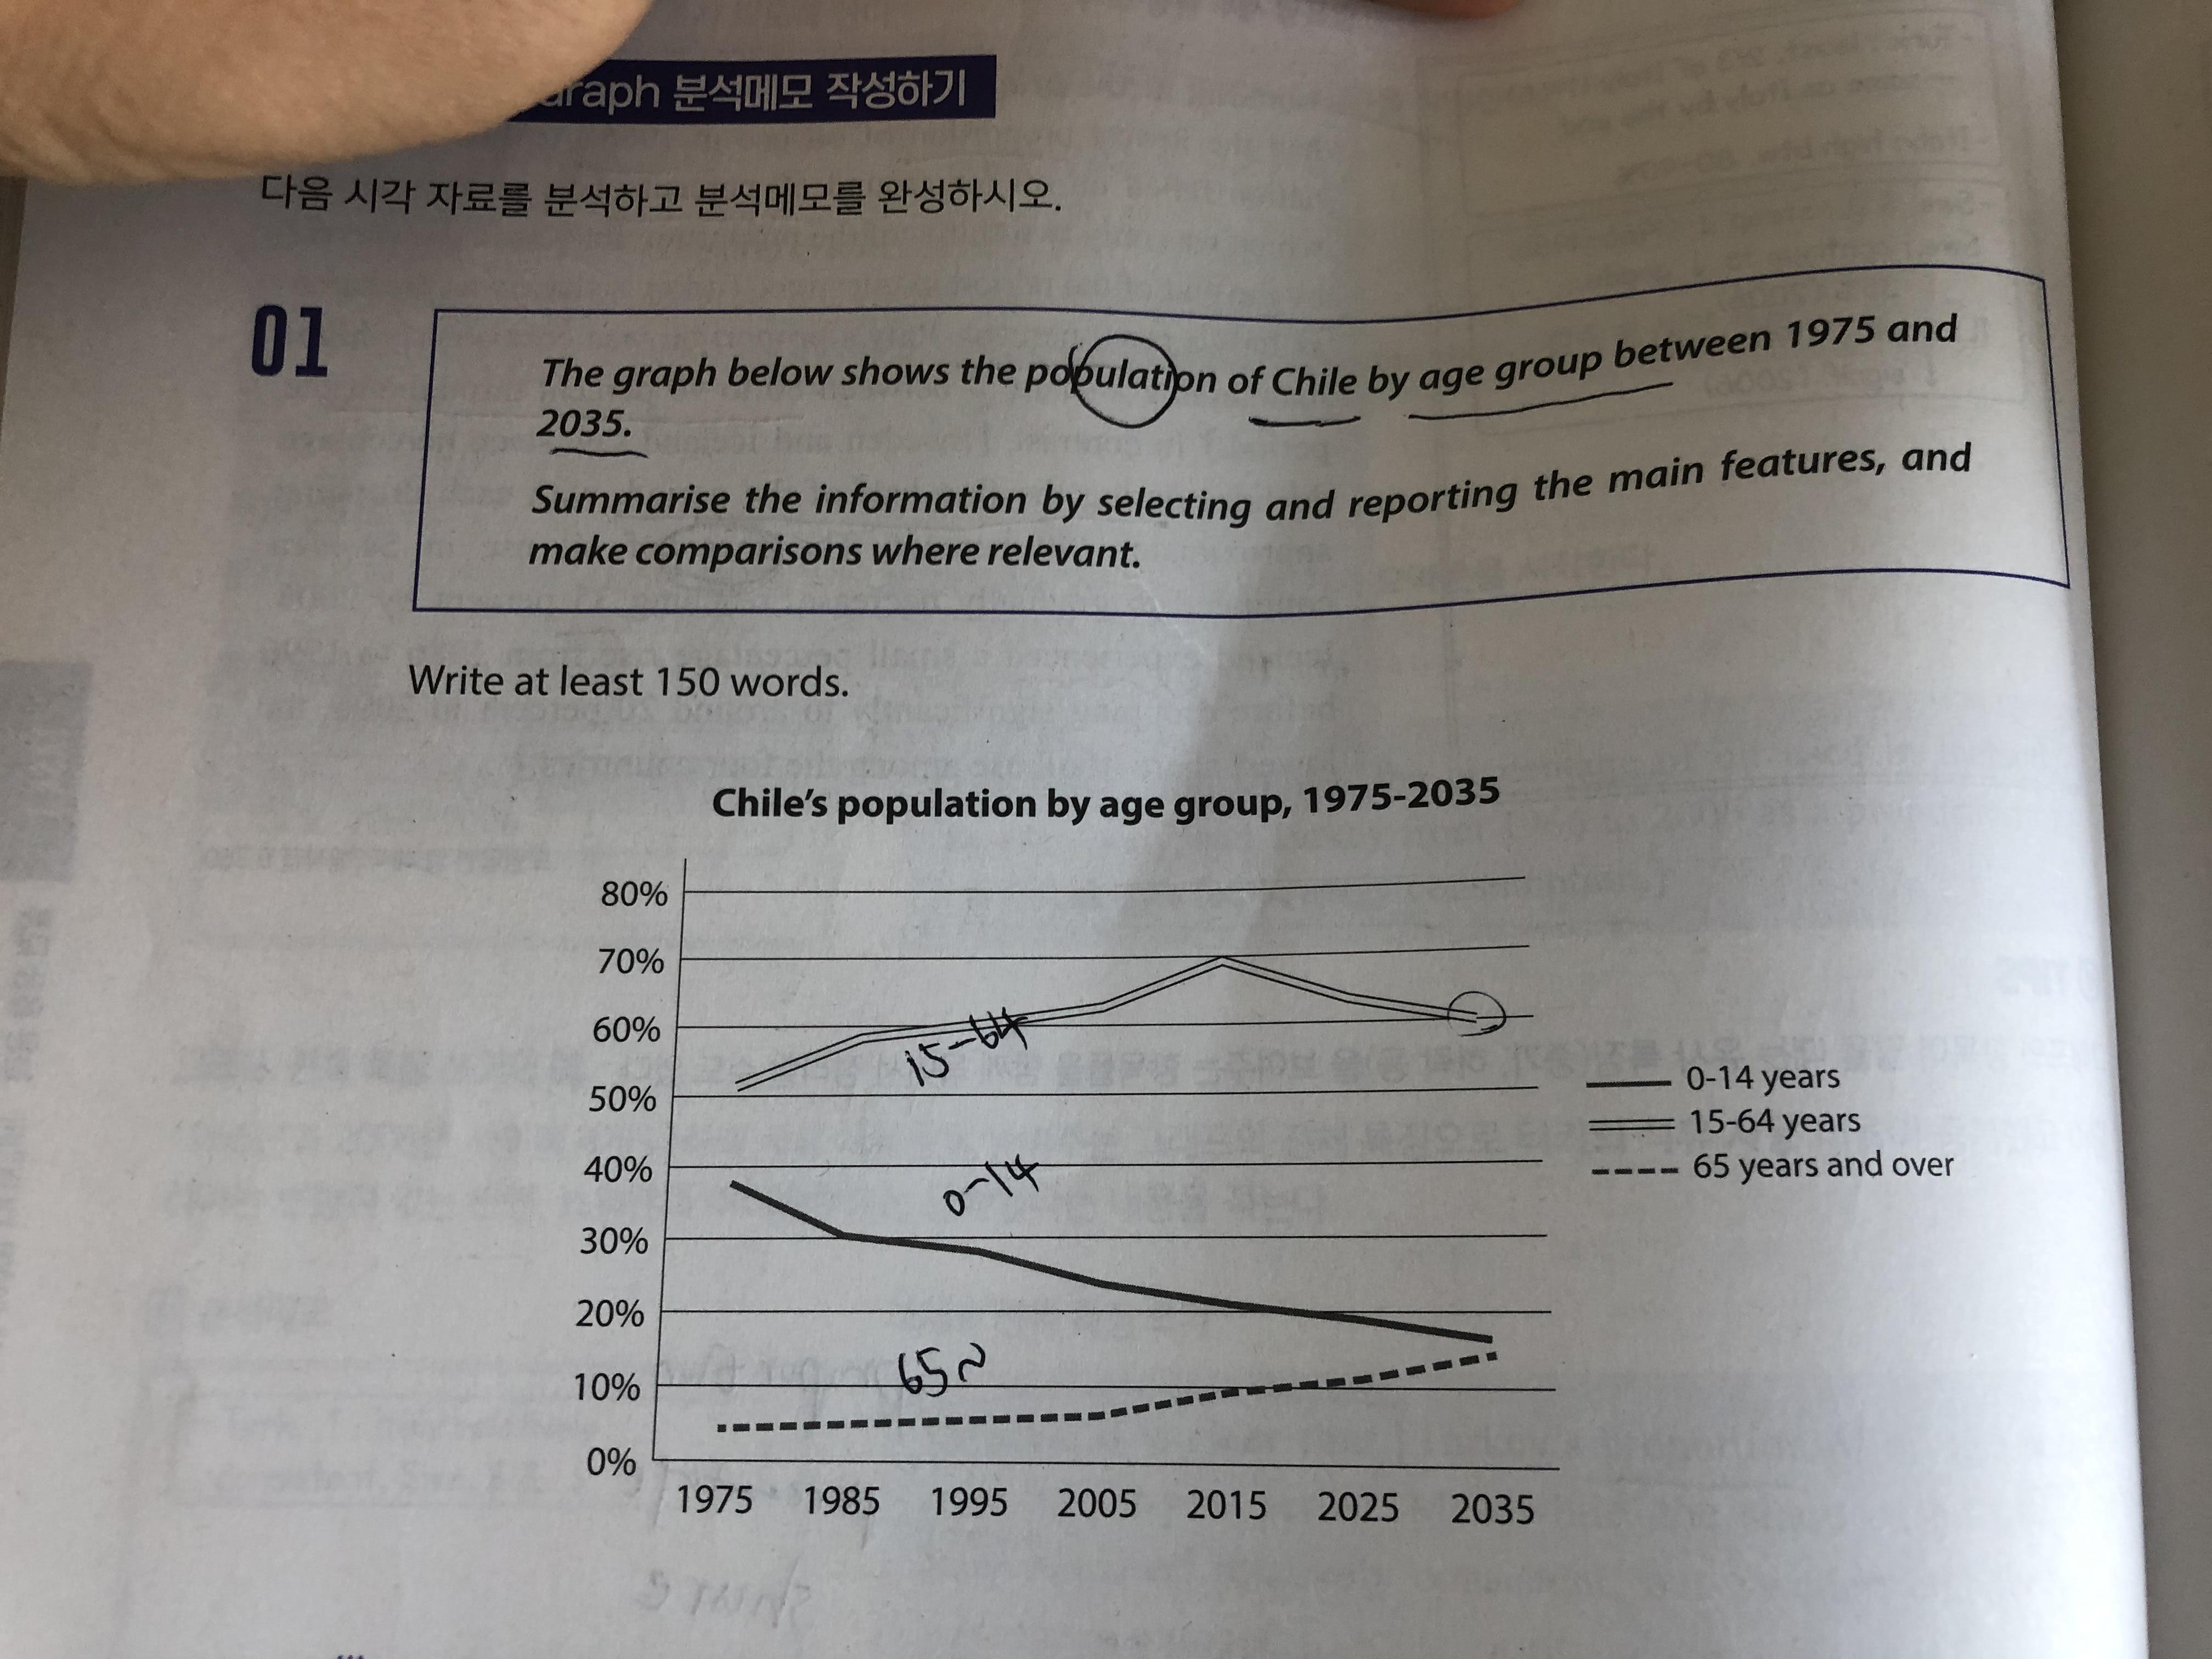
This graph represents proportion of citizens of Chile by three age groups, 0 to 14 years, 15 to 64 years, and 65 years and over from 1975 to 2035.
Overall, population over 15 years has a increasing trend. Whereas, the figure of people under 15 years is decreasing. Furthermore, there is a definite order of the those 3 groups, in that proportion of people from 15 to 64 years is always the largest, and other 2 sectors are below that.
Looking at the graph more closely, even though the figure of people of 15 to 64 years old had been soaring up 70%, it started to decrease gradually since 2015 by 10%. As for people under 15 years old, portion of them in whole population kept declining from 40% to below 20%. Furthermore, it is interesting that it is going to cross with the group of people over 65 years old around 2035 at the point of 15%. In contrast, as long as the sector of citizens over 65 years old, the percentage is growing, especially since 2005 from 5% to 15%.

 댓글 0개
댓글 0개


 불편사항 신고