


 인쇄
인쇄


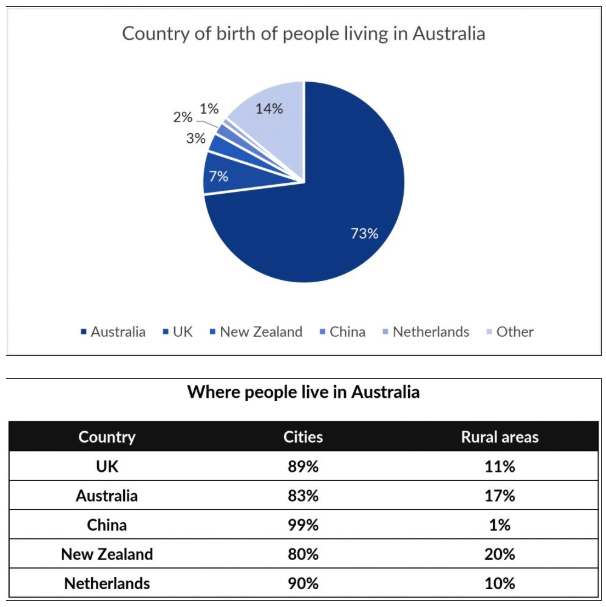
The pie chart shows the information about the country of birth of people living in Australia and the table shows where people born in these countries live.
(이 위치에 Overview를 넣어주시면 됩니다. 그리고 Overview를 떠나서 현재 글자수 자체가 부족하기 때문에 어차피 보완이 필요하고요.)
In the pie chart, 73 percent of people living in Australia was born in Australia. 17% of these people live in rural areas However, the percentage of people who live in rural areas is 17 percent which shows the second largest rate in terms of those who live in the countryside is second largest amount of percent. New Zealand which has 3 percent of birth country of people living in Australia has 20 percent of people living lived in rural areas of Australia.
The most of people who born in china live in cities of Australia. It has 99 percent. As for people who were born in China, 99% percent of them live in cities, which shows the highest number among the five countries. It is the only country that the rate of people live in rural areas is less than 10 percent which is 1 percent.
총평: (5/6/6/6) 6.0
(일단 저는 글자수 부족에 따른 감점은 따로 하지 않는데, 실전에서는 감점이 있기 때문에 감안하고 보셔야 합니다.)
task 1에서는 Overview를 넣는 게 가장 중요합니다. 아무리 세부적인 분석이 잘 되었다고 하더라도 정작 표의 전반적인 내용을 포괄할 수 있는 Overview가 없으면 TA에서 5점을 넘기기 어려우므로 반드시 추가해주세요!
수고하셨습니다 :)

 비밀번호 확인
 댓글 0개
댓글 0개


 불편사항 신고