


 인쇄
인쇄


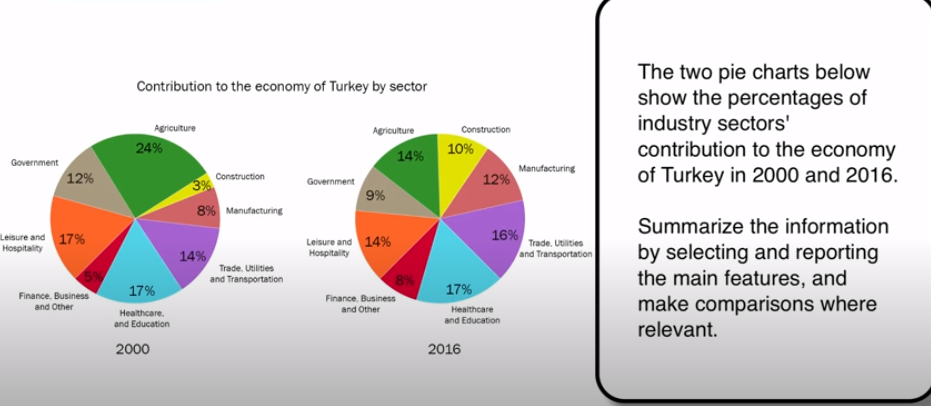
The given pie
charts provide information on the contribution to Turkey’s economy by different industry
sectors for the years 2000 and 2016.
Overall, the top three
sectors – including which are agriculture, healthcare and education, and leisure– constituted
almost three-fifths of the total share in 2000. However, this trend changed in 2016,
with the categories of healthcare and trade accounting accounted for the largest percentage.
For the year
2000, the agriculture sector contributed the largest percentage to the economy,
with 24 percent, followed by the leisure and healthcare industries, which each took up
17 percent respectively. Meanwhile, the two industries that showed the least
contributions were construction and finance, with about 8 percent of the total.
In regard to
2016, each sector showed a similar contribution to Turkey’s economy. While
the percentage of agriculture decreased sharply from 24 percent in 2000 to 14
percent in 2016, that of construction had an increase, reaching 10 percent. It is
noticeable that the healthcare and education sector remained relatively stable in rate, in both years.
걸린시간 20분 목표점수 7.0 감사합니다
총평: (7/7/7/7) 7.0
크게 문제는 없었고, 주어를 잘 잡는 것에 있어서만 조금 주의해주시면 될 것 같습니다. 문장 구조는 아주 최소한 이정도 선에서 다양해야합니다. 여기서 더 다채로워지면 당연히 좋지만, 여튼 아까 그 rent accommodation글처럼 제한되지만 않게 해주세요!
수고하셨습니다 :)

 비밀번호 확인
 댓글 0개
댓글 0개


 불편사항 신고