


 인쇄
인쇄


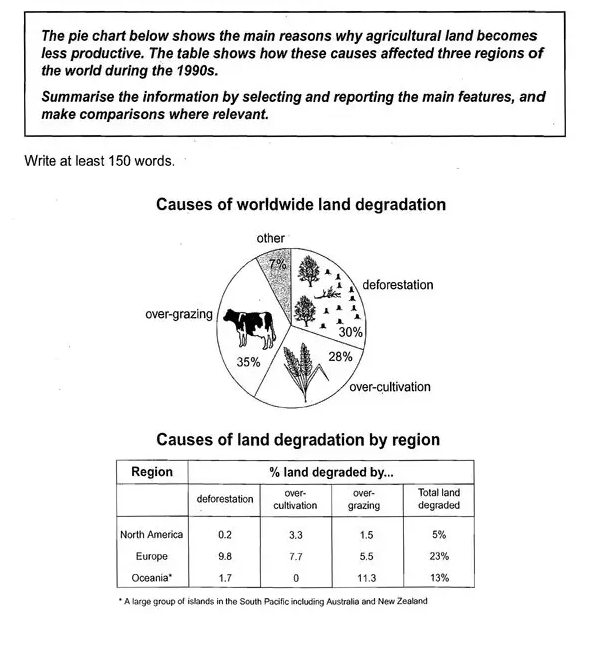
The charts give information about factors that caused global (이거, 혹은 worldwide중 하나는 꼭 들어가야 합니다.) land degradation and the impact of those on three different regions in the 1990s.
Roughly speaking, three causes - which are over-grazing, deforestation, and over-cultivation - accounted for the majority of the total rate. While the former two causes were serious in Europe, over-grazing contributed the most to land degradation in Oceania.
With regard to the pie chart, 35% of land was degraded due to causes was over-grazing, which was the largest proportion. This was followed by deforestation and over-cultivation, each representing 28 percent and 30 percent respectively. Apart from these causes, other causes showed only 7 percent.
When it comes to the table chart, Europe saw 23 percent of the total land degradation, with deforestation and over-cultivation being the main reasons. Meanwhile, the proportion of degraded land in Oceania was 13 percent, coming after Europe. It is noticeable that over-grazing was the largest percentage among other figures, with 11.3 percent. (북미도 적어주세요! 아예 생략할 수는 없습니다.)
154자 인데 한 170자 정도 적는게 이상적인가요? -> 맞습니다
150자 넘기기만 하면 일단 감점은 안들어가는 거죠? -> 맞습니다
아, 그리고 이렇게 표가 두개가 나오는 문제는 오버뷰에서 최대한 연결시켜서 써주는게 좋나욤? -> 좋긴 한데, 그게 연결되는 경우에만 해당됩니다. 연결이 안 되는 두 표를 가지고 억지로 연결시키려고 하면 역효과가 날 수 있어요!
총평; (7/7/7/7) 7.0
이번 글 잘 써주셨습니다. 패러프레이징도 잘 된 편이고, 딱 한 가지 아쉬운 점이 있다면, 마지막 문단에서 북미 쪽이 아예 빠진 것이 됩니다. 그래도 7점 받는데에는 괜찮을 거고, 혹여나 6.5 받더라도 task2에서 벌어갈 수 있는 점수는 될 겁니다.
수고하셨습니다 :)

 비밀번호 확인
 댓글 0개
댓글 0개


 불편사항 신고