


 인쇄
인쇄


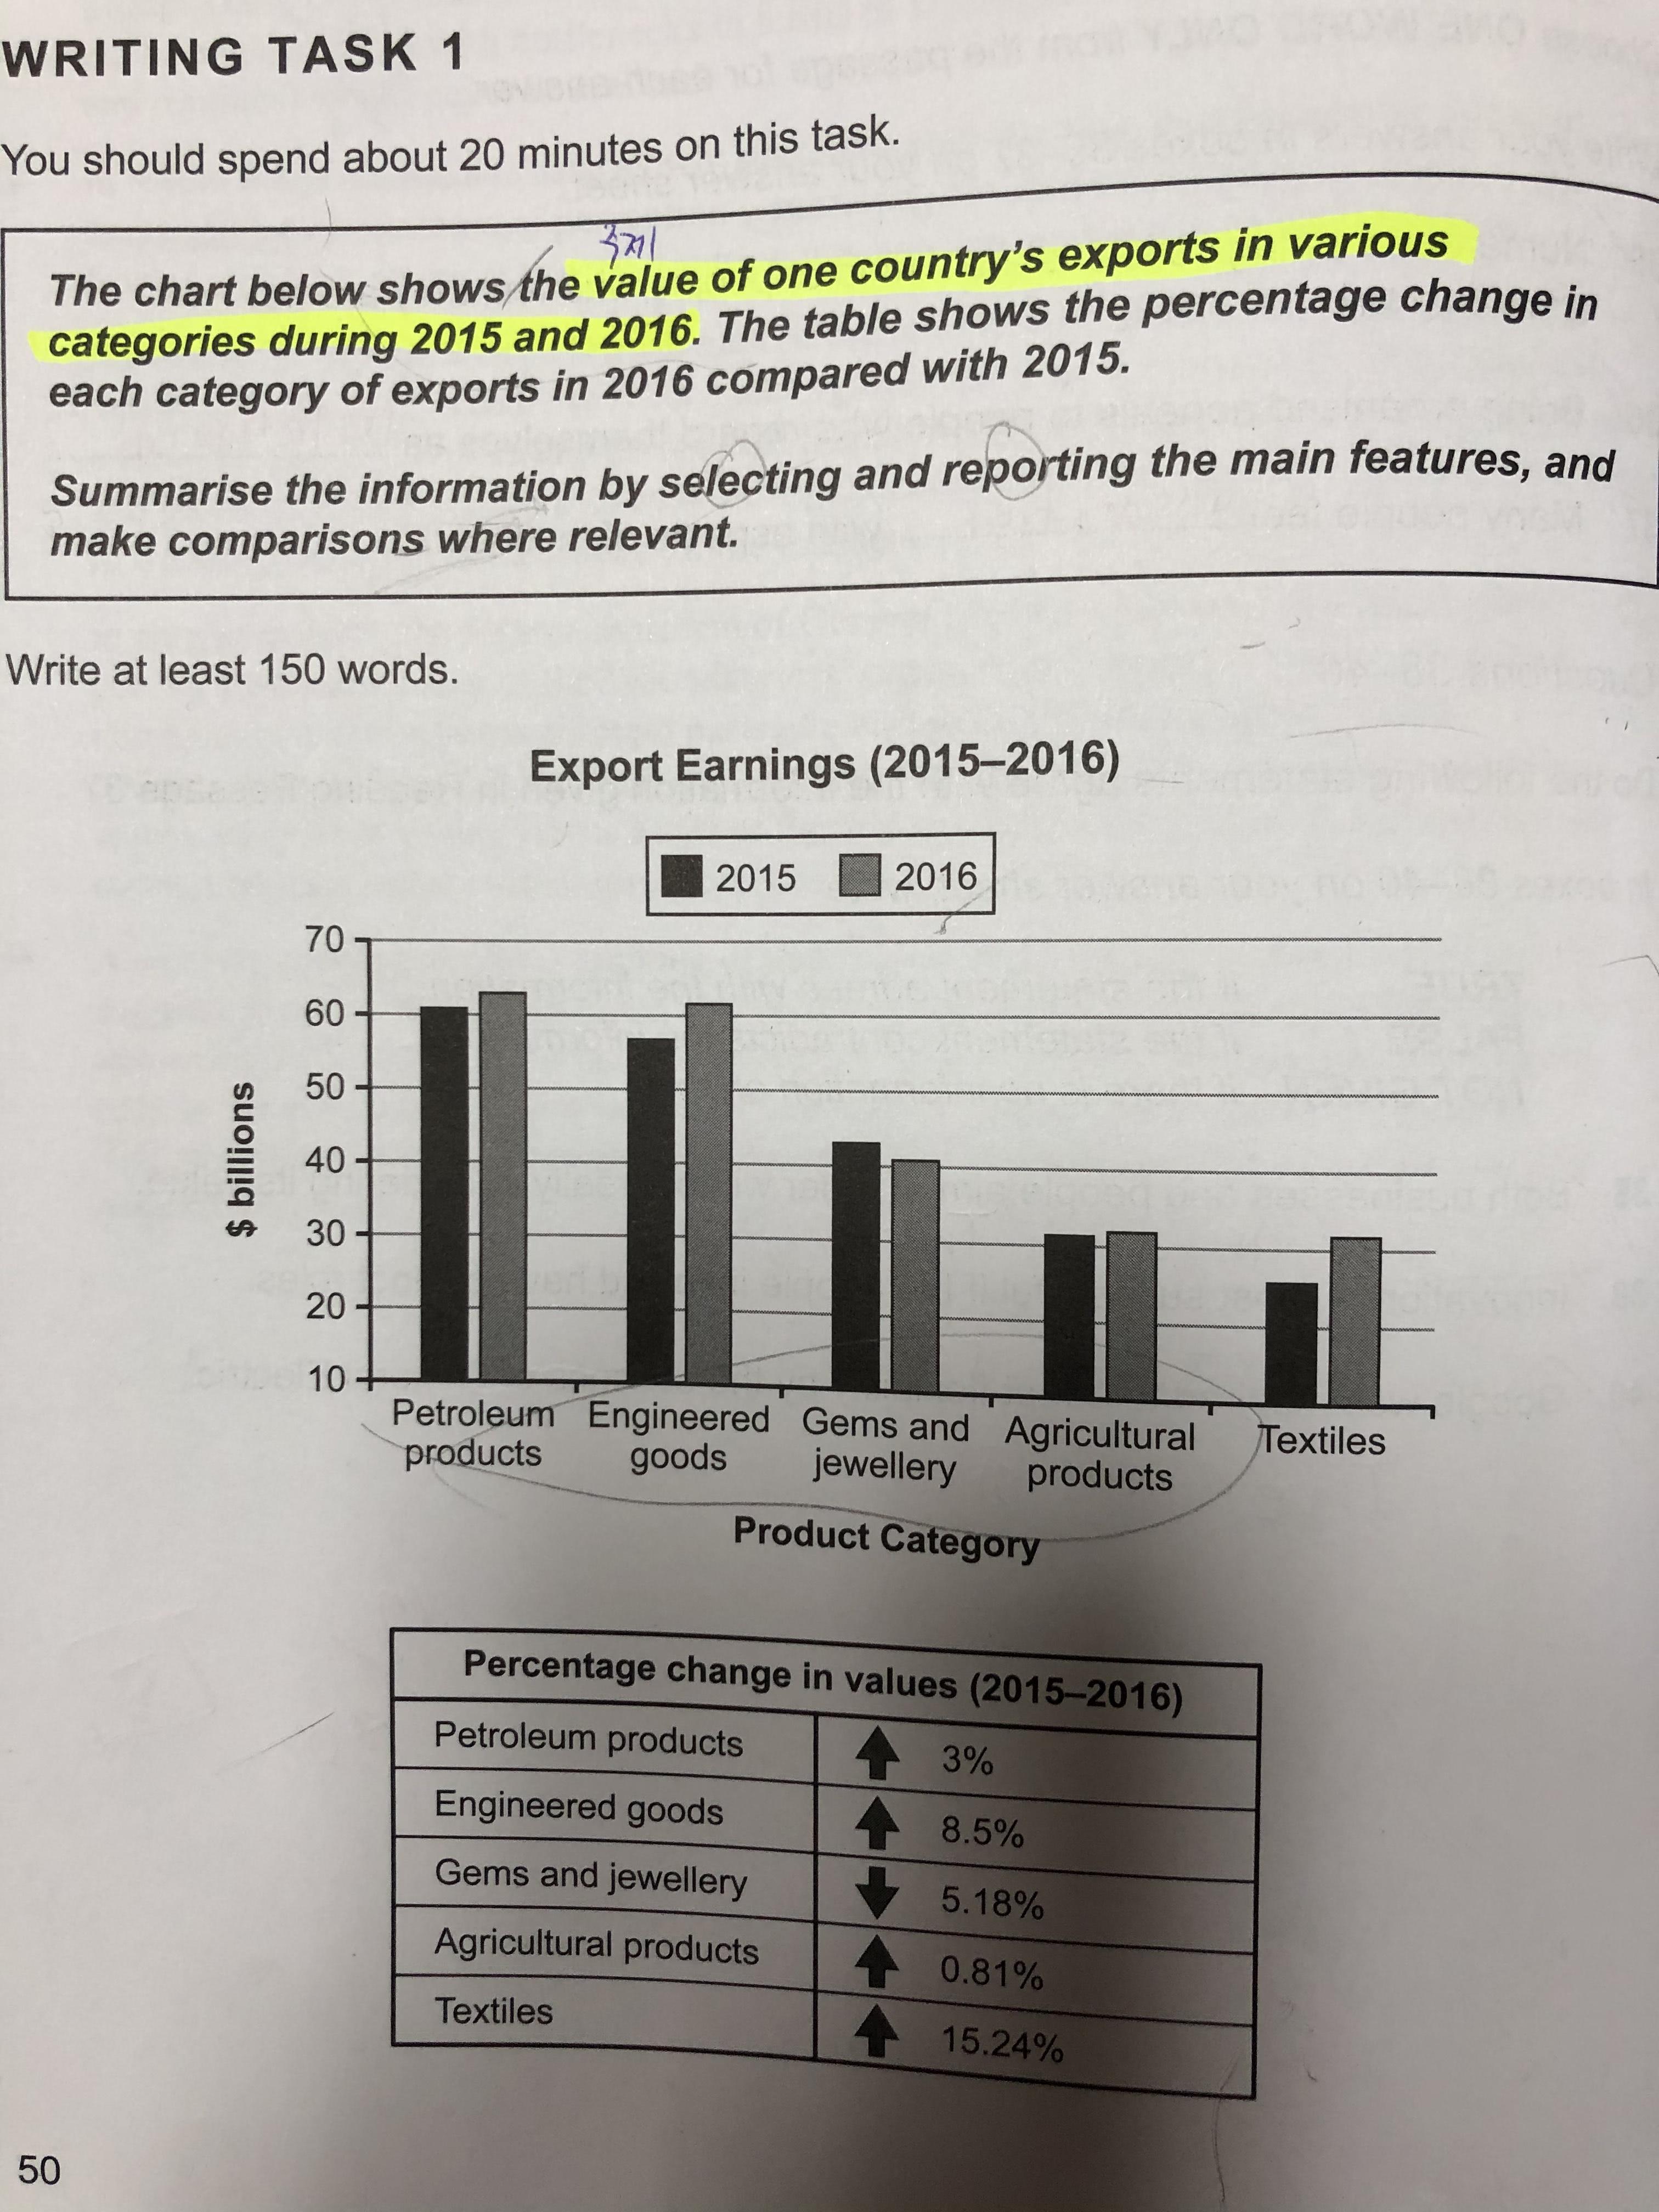
The chart shows that the value of one country's exports in various categories during 2015 and 2016. Each categories increased values except for Gems and Jewellery. The proportion of Petroleum products are approximately twice than percentage of textiles.
Petroleum products are the most exporting earnings by the 2015 and 2016 both. Engineered goods increased 8.5% more than the year 2015. All the figures of the bar graph indicates the growth of export earnings with the exception of Gems and Jewellery. It quite decreased by 5.18% by the year 2016. In addition, The percentage of Agricultural products rose slightly 0.81% which is not over 1%. You can sea the most increased percentage point in Textiles. The figure is grown by 15.24% by the year 2016.
In conclusion, All product category has changed in the year 2016 than the year 2015. Even though Petroleum products is the largest export earnings, but, growth rates of the largest export amount is Textiles.

 댓글 0개
댓글 0개


 불편사항 신고