


 인쇄
인쇄


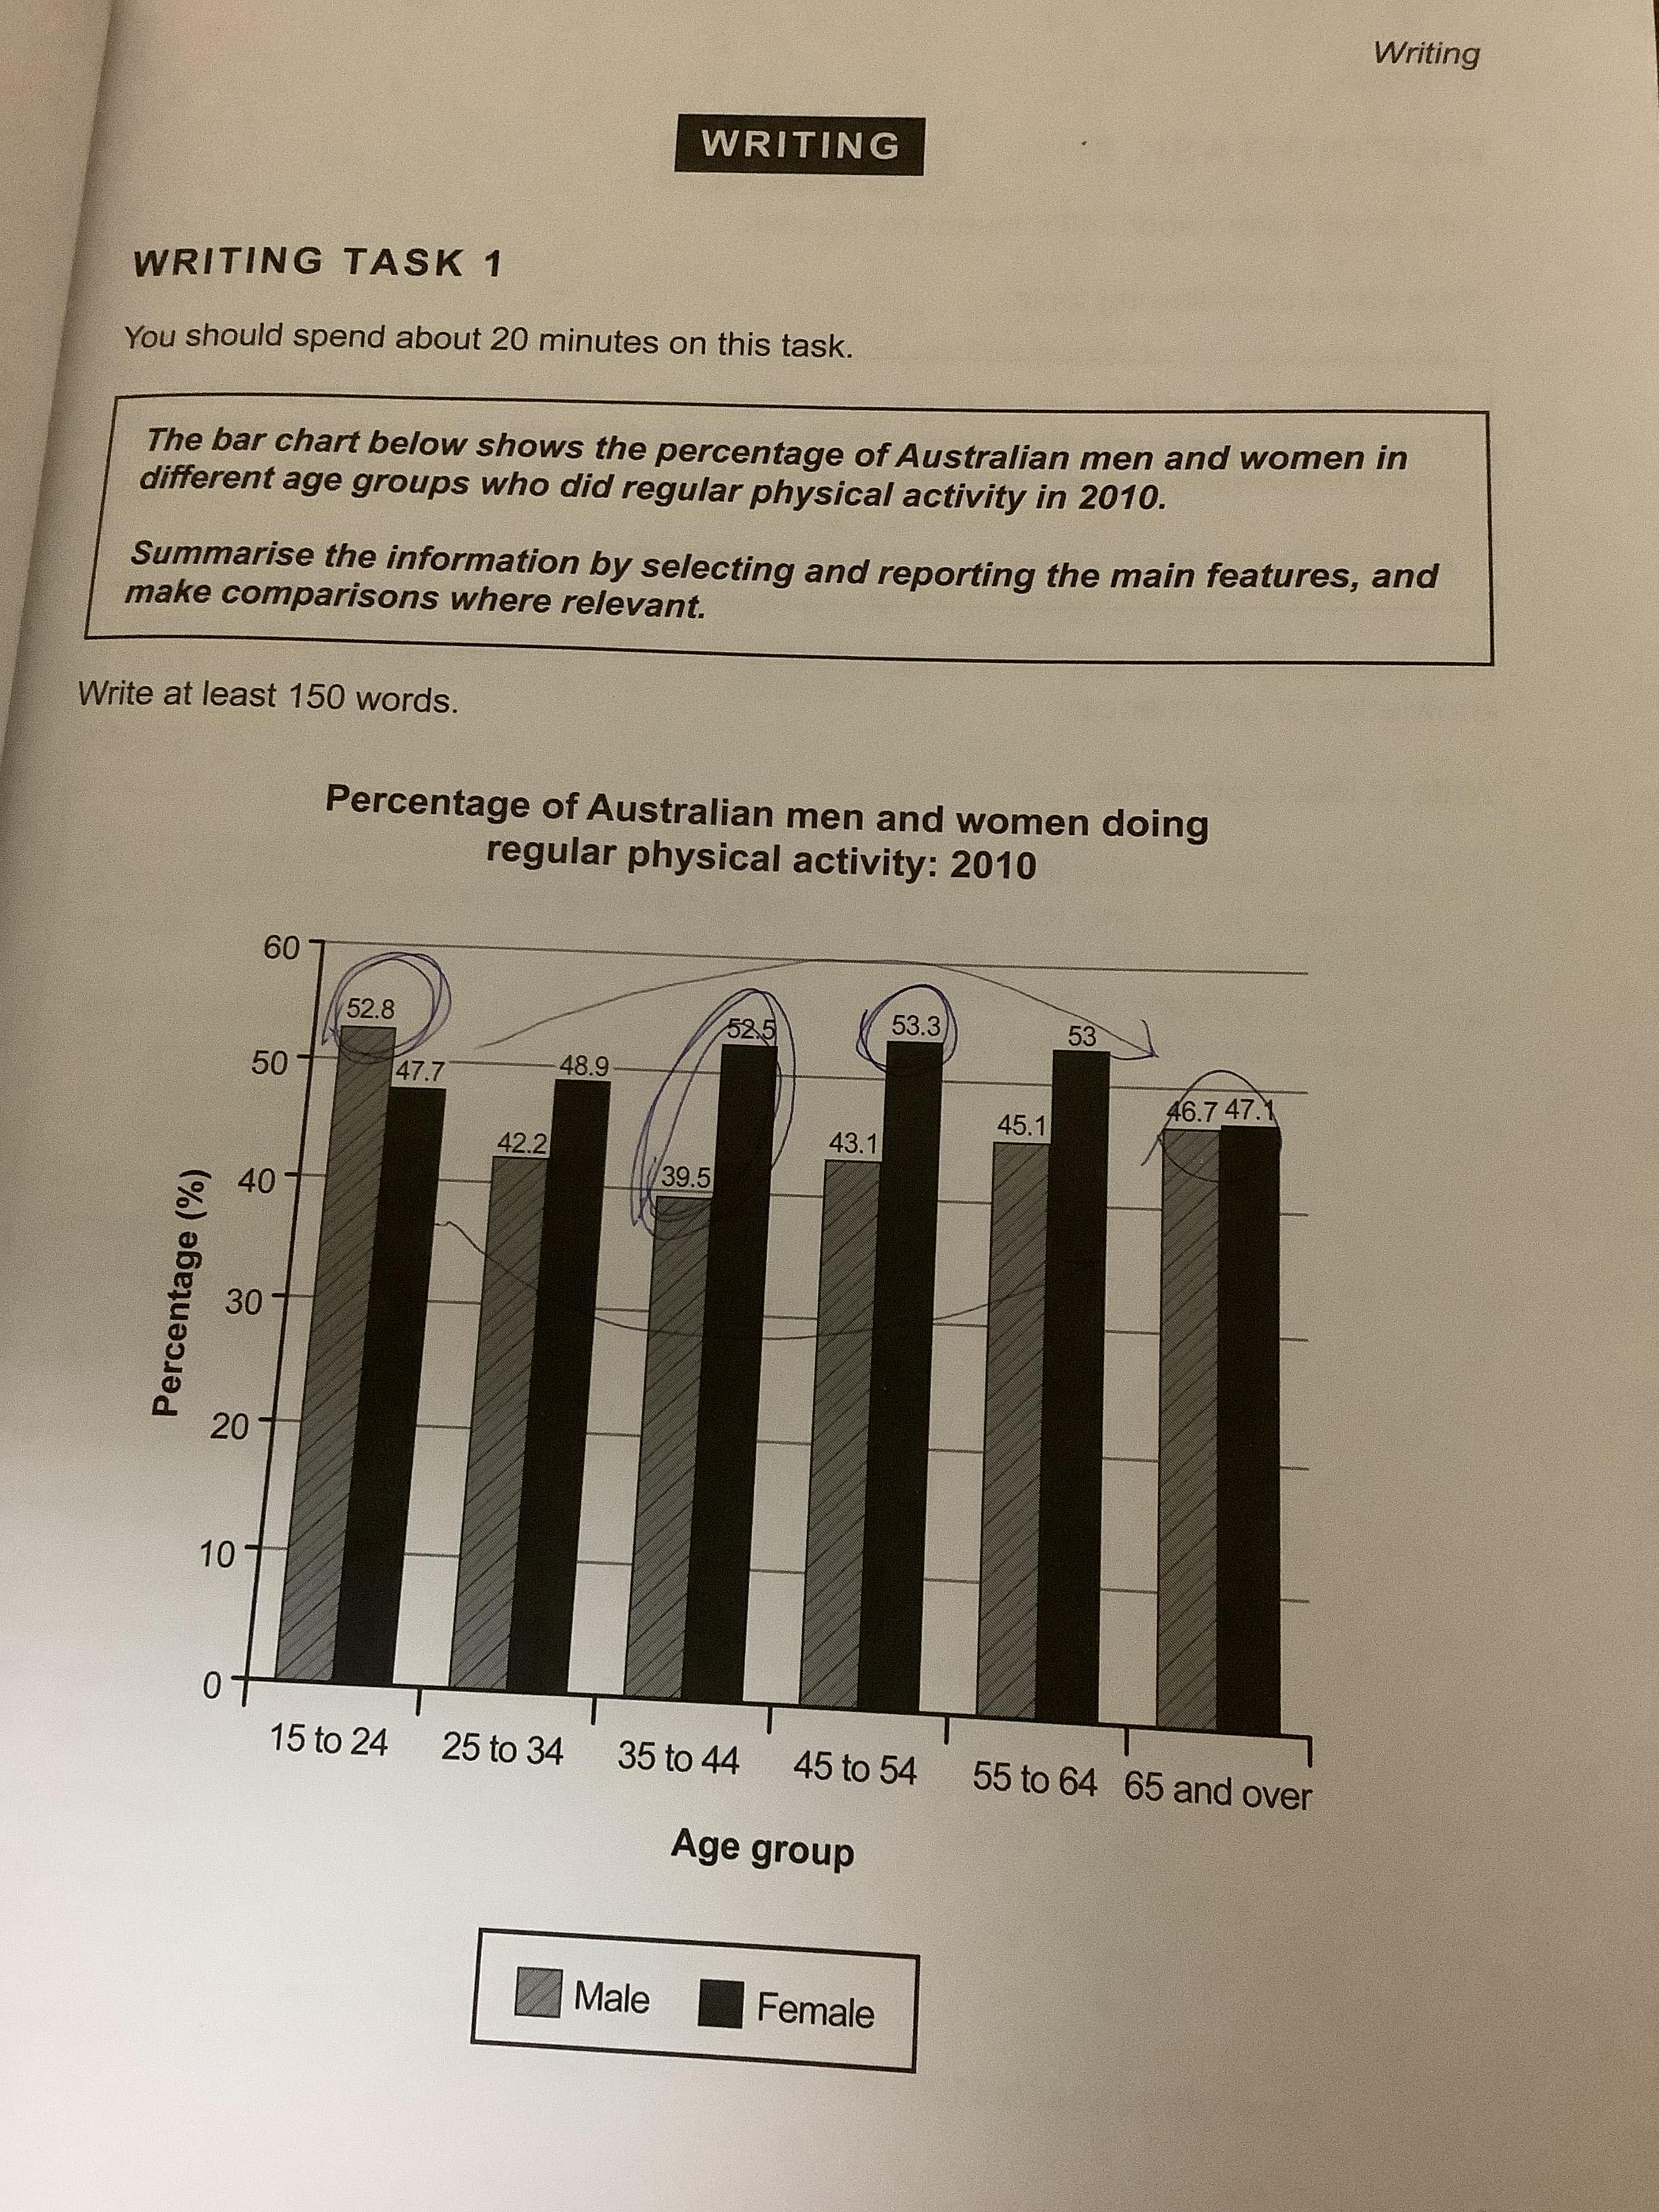
The graph show the proportions of male and female doing physical activity regularly in various age groups in Australia in 2010. Overall, the significant gap between male and female appears in the group of the age 35 to 44 and the percentage of male in 15 to 24 account for the highest rate among the categories while female in 45 to 54 take the most portion of them.
The most notable feature is the fact that the biggest gap between male and female is in the age group of 35 to 44 (39.5%, 52.5%, respectively). In addition, it is measured similar rate at the age group 65 and over. The percentage of female represent higher than male in most groups.
The trend of female draw upward and drop after hitting the peak at the age of 45 to 54 by 53.3% while the percentage of male goes down until 39/5% in the age group of 35 to 44 and start to increase. The highest rate in male is 52.8% which is in the group of 15 to 2 and in female is 53.3 in 45 to 54.
.

 댓글 0개
댓글 0개


 불편사항 신고