


 인쇄
인쇄


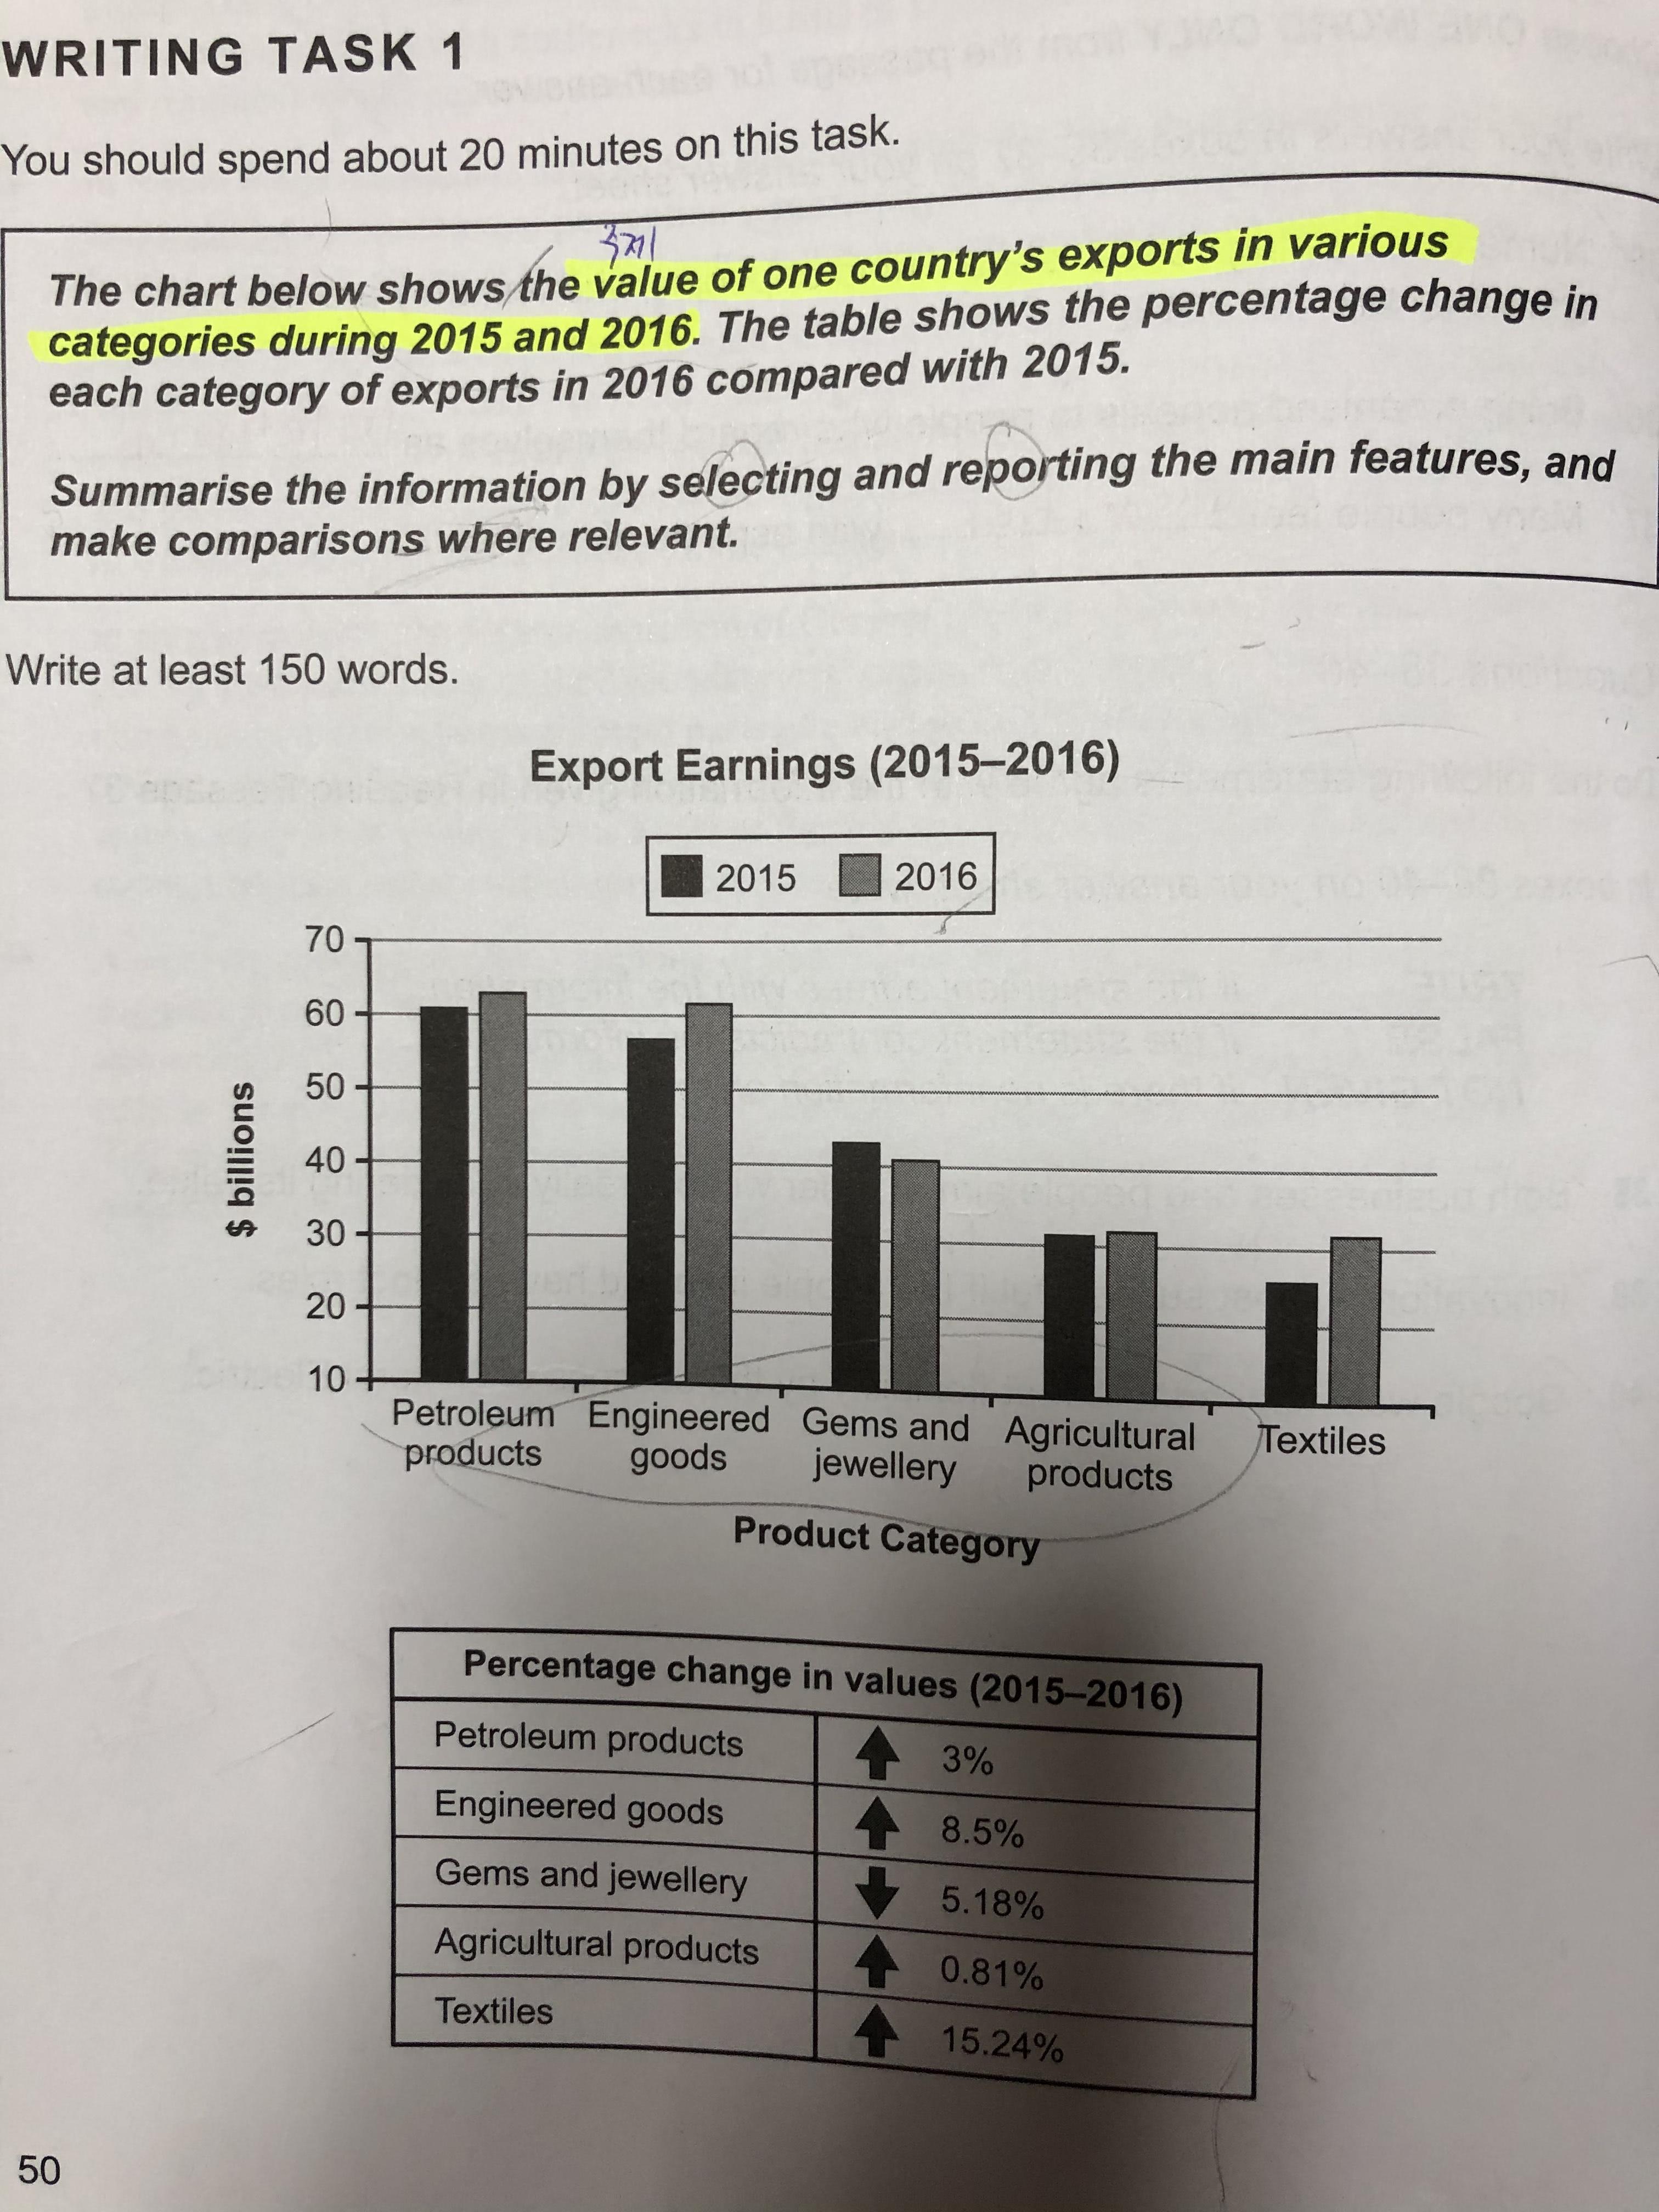
The chart shows that (많은 수험생들이 틀리는 사항이므로 주의해주셔야 합니다.) the value of one country's exports in various categories during 2015 and 2016. Overall, each Each categories increased in values except for Gems and Jewellery (여기 포함, 모든 항목들은 소문자 시작입니다. 다른데에도 다 바꿔주세요~). The proportion of Petroleum products are is approximately twice as high as the than percentage of textiles.
(제가 해드린 것처럼, 문단이 구분될 때에는 엔터를 두 번 쳐주시면 됩니다.)
Petroleum products are show the most exporting earnings in both 2015 and 2016 by the 2015 and 2016 both. Engineered goods increased 8.5% more than the year 2015. All the figures of the bar graph indicates the growth of export earnings with the exception of Gems and Jewellery. It quite decreased by 5.18% by the year 2016. In addition, The the percentage of Agricultural products rose slightly 0.81% which is not over 1%. You can sea the most increased percentage point in Textiles. (2인칭은 구어에 해당하므로 글을 쓸 때 따로 쓰지 않습니다.) The figure is grown by 15.24% by the year 2016.
In conclusion, All product category has changed in the year 2016 than the year 2015. Even though Petroleum products is the largest export earnings, but, growth rates of the largest export amount is Textiles. (task 1은 결론을 내기 위해 존재하는 글이 아닙니다. 이를 대신해서 서론 밑에 Overview라는 것을 넣어주시면 되는데, 이에 대해서는 총평에서 말씀드릴게요.(
총평: (5/5/6/5) 5.5
문단 배분에 있어 수정이 필요합니다. 기본적으로 Task1에서 문단을 배분할 때에는, 서론-Overview-세부적인 분석 순으로 다뤄주시면 돼요. 이번 자료의 경우 표가 두 개이므로, 이를 각각 하나의 문단에 넣어주시면 되므로, 서론-Overview-표1-표2 네 개의 문단을 만들면 됩니다. 결론은 따로 들어가지 않으므로 주의해주세요~
수고하셨습니다 :)

 비밀번호 확인
 댓글 0개
댓글 0개


 불편사항 신고