


 인쇄
인쇄


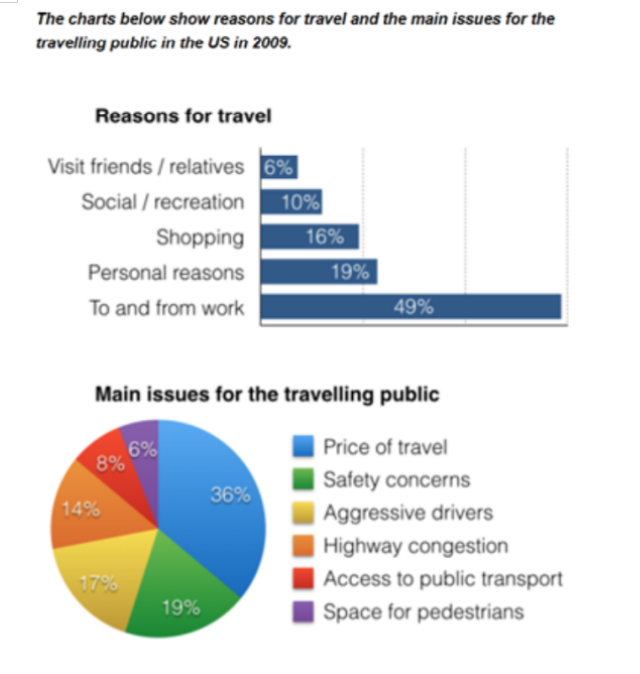
The given graphs describe the reasons for an Americans travelling in 2009, along with the six issues for the while travelling publics.
Overall, it seems that nearly half of the Americans travel to commute and the price of travel accounted for the largest portion of the main issue of travelling.
Looking at the graph more closely, one can see that the reason of travel for work reason was showed (이거 was는 부자연스럽습니다. 많이들 틀리는 사항이므로 주의해주세요!) the highest percentage, by 49%. It is followed by personal reason and shopping in sequence, 19% and 16% respectively. Visiting friends and relatives was the lowest rate of 6%. It is noticeable that, except for the commute, all the other reasons were under 20%. (여기부터는 그냥 새로운 문단으로 가주시면 됩니다.) In the second pie chart, 36% of the people complained about the problem of price. Safety concerns, aggressive driver, and highway congestion have a relatively similar ratio of by 19%, 17%, and 14%. In 2009, 8% of respondents were not satisfied with the accessibility to public transport. The lowest rate in the given chart was 6%, which was the complaint about the space for pedestrians.
wc:172
총평: (7/7/7/7) 7.0
이번 글의 경우도 제가 cacaonibs님께 기대하는 최대치로 잘 쓰였습니다. 패러프레이징이 어느정도는 되었다는 점이 가장 긍정적이네요.
앞으로도 이정도로만 유지할 수 있도록 노력해주시고, 마지막 문단 was는 이번 기회에 고쳐보세요~
수고하셨습니다 :)
항상 감사합니다 :)

 비밀번호 확인
 댓글 0개
댓글 0개


 불편사항 신고