


 인쇄
인쇄


Q ; The chart shows the proportion of renewable energy in total energy supply in 4 countries from 1997 to 2010.
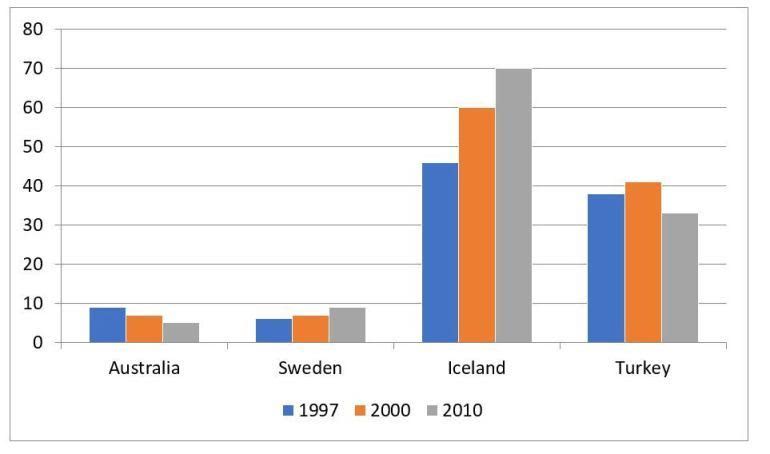
The bar charts illustrate how much renewable energy is used in four countries from 1997 to 2010.
In general, it is shown that in Iceland and Turkey, the greatest amount of renewable energy is consumed in all periods while the proportions of Australia and Sweden are no more than 10.
With regard to this figure, Iceland recorded the first place in all periods by nearly 45, 60, and 70 with a constant growth. Despite growing up to 40 from 1997 to 2000 in Turkey, however, this proportion diminished by below 40 in 2010.
On the other hand, in Sweden, this country supplied renewable energy by below 10 which is the lowest proportion as same as 2010 of Australia in 1997. Nonetheless, there is a small rise in the bar of Sweden from then. Meanwhile, in two countries of Australia and Sweden, the highest proportion in 1997 took up by almost 10 in Australia, but, there is a reduction of energy supply from 1997 to 2010.
총 166단어
16분
차트 서술할때 시제를 어떻게 해야하는지 궁금해요.. 시간에 따라 과거로 바꿔 쓰기도 하는건지 아니면 이미 결과가 나와있는 표나 차트니까 다 현재시제로 써야하는지.. 쓸때마다 너무 헷갈리는데 저는 그냥 한국어로 다시 해석해보고 어색하면 고치는 방법을 쓰거든요 근데 이게 시간을 꽤 잡아먹는거 같아서요 ㅜㅜ 혹시 방법이 있나요? 그리고 항상 감사합니다~!

 댓글 0개
댓글 0개


 불편사항 신고