


 인쇄
인쇄


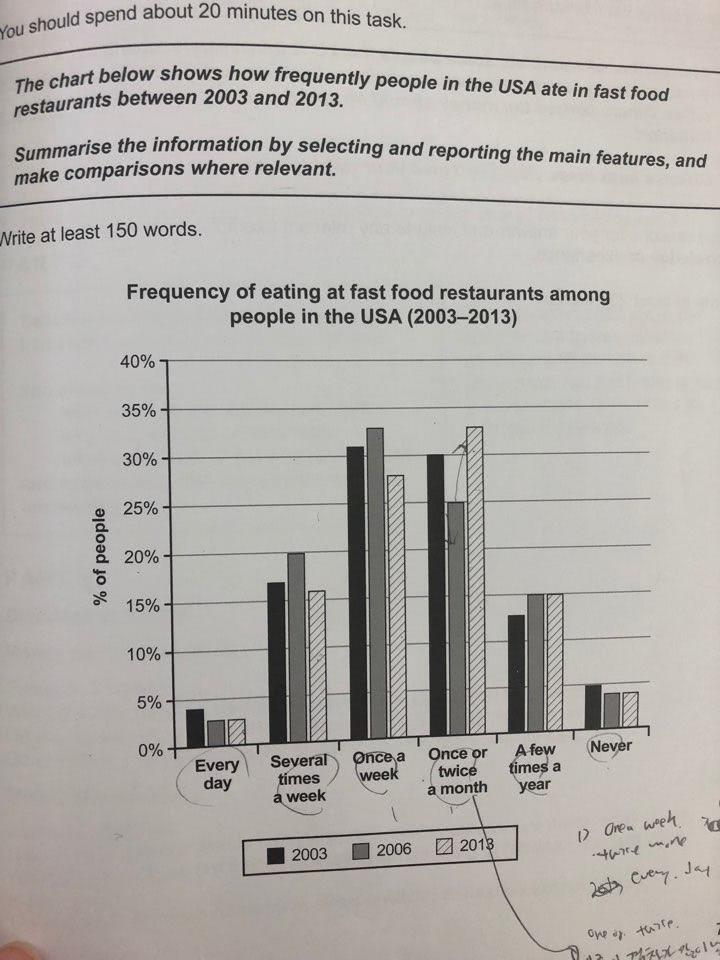
The given graph gives information about how often people in the USA consume in fast food restaurants in 2003,2006 and 2013l
In general in three years the ratio of people who are in fast food restaurants 'once a week' or 'once or twice a month' accounted for high proportion. Besides, The percentages of people who ate once or twice a month showed the biggest change between 2003 and 2013.
On closer inspection, in 2003 the ratio of people who ate once a week and once or twice a month was 32% and 30% respectively, besides, in 2006 the ratio was 33% and 25% and finally in 2013 28% and 33%. The sum of people who ate once a week and once or twice a month in each year was 62%,58% and 61%, which was more than half.
In addition, the percentage of people who ate once or twice a month in fast food restaurants in 2003 was 30% and in 2006 it dropped to 25% and finally it increased to 33% which was the biggest increase.
목표 6.5
시간 18분
포인트잡기가 조금 어려웠습니다.. 항상 감사드립니다!

 댓글 0개
댓글 0개


 불편사항 신고