


 인쇄
인쇄


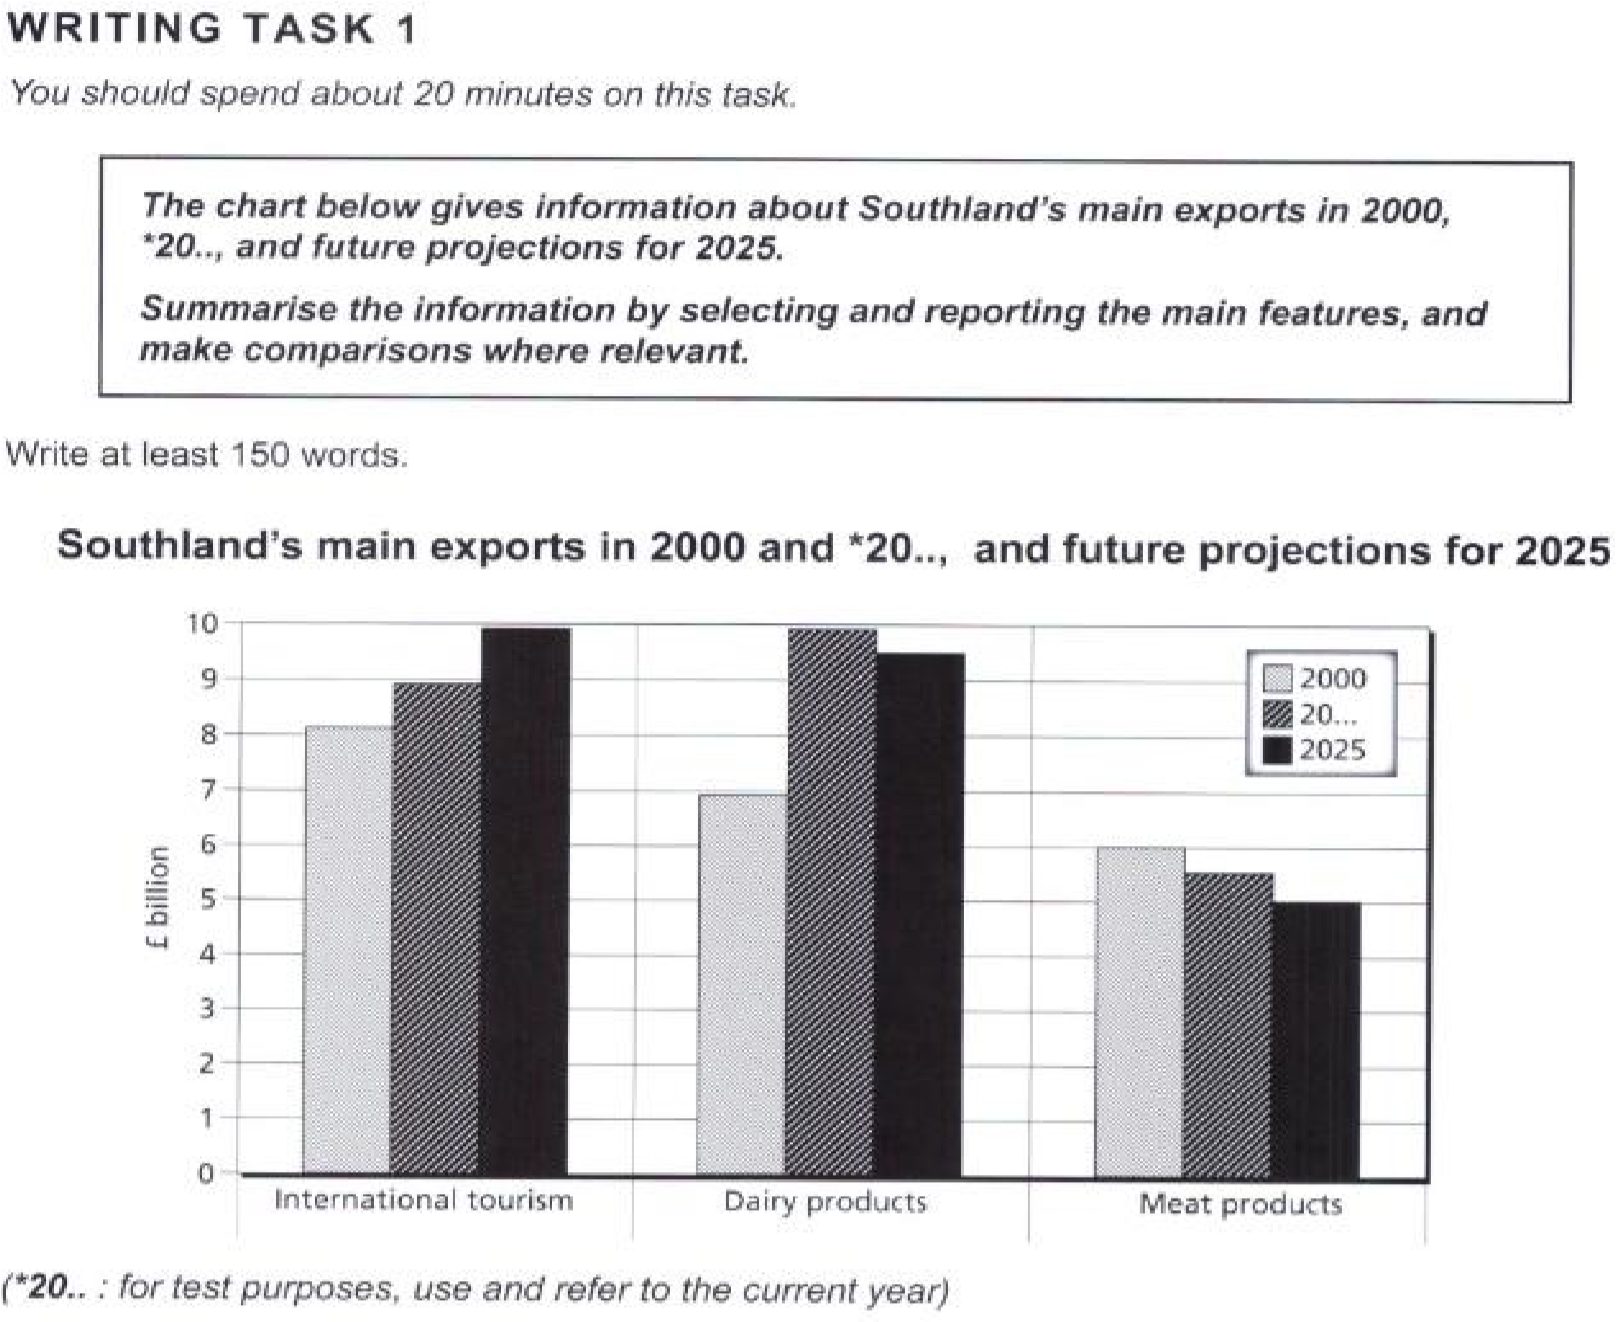
The bar graph depicts the main exports of
Southland and its figures in 2010 (2000년인데 날짜를 잘못 보셨습니다. 다른데에도 다 수정해주세요!), 2020. Also, it shows the projections for
2025. Overall, international tourism and dairy products have increased from
2010 to 2020, but dairy products would have fallen while tourism will increase
constantly. (이 문장의 주어는 항목 자체가 아닌, 해당 항목들의 수출로 잡아주셔야 합니다.) The export of meat has decreased, and it also is expected to fall will have fell gradually
until 2025.
According to the chart, it is obvious that
the export of international tourism has increased in 2010, 2020 and it would incline have inclined gradually in 2025. The figure was about 8 billion pounds in 2010
and it would be 10 billion pounds in 2020. Meanwhile, dairy products were
exported to 7 billion pounds of dairy products were exported in 2010, but it has accelerated to £10 billion (위의 경우도 단위 표현은 이걸로 통일해주세요!) in current days. However, in 2025, the figure will have
fell slightly to £9.5 billion.
It is also noteworthy that meat had the
least lowest figure among main exports in 2010(£6 billion), it
has declined briefly to 5.5 billion pounds. (언제 그랬는지에 대해 적어주세요~) In the next 5 years, meat products
would have experienced a decrease, its figure will be to £5 billion that would be half of tourism.
총평: (5/6/6/6) 6.0
이번 글은 평소 nallalee님 실력에 비해 많이 아쉬웠습니다. 일단 2000년을 2010년을 내내 작성하신 건 점수에 있어 치명타를 줄 수 밖에 없으므로, 꼭 항목을 꼼꼼히 확인해주세요~또한 단위 표현에서도 항상 일관성이 있어야 합니다. 지금은 이랬다저랬다 하므로 꼭 수정해주세요!
수고하셨습니다 :)

 비밀번호 확인
 댓글 0개
댓글 0개


 불편사항 신고