


 인쇄
인쇄


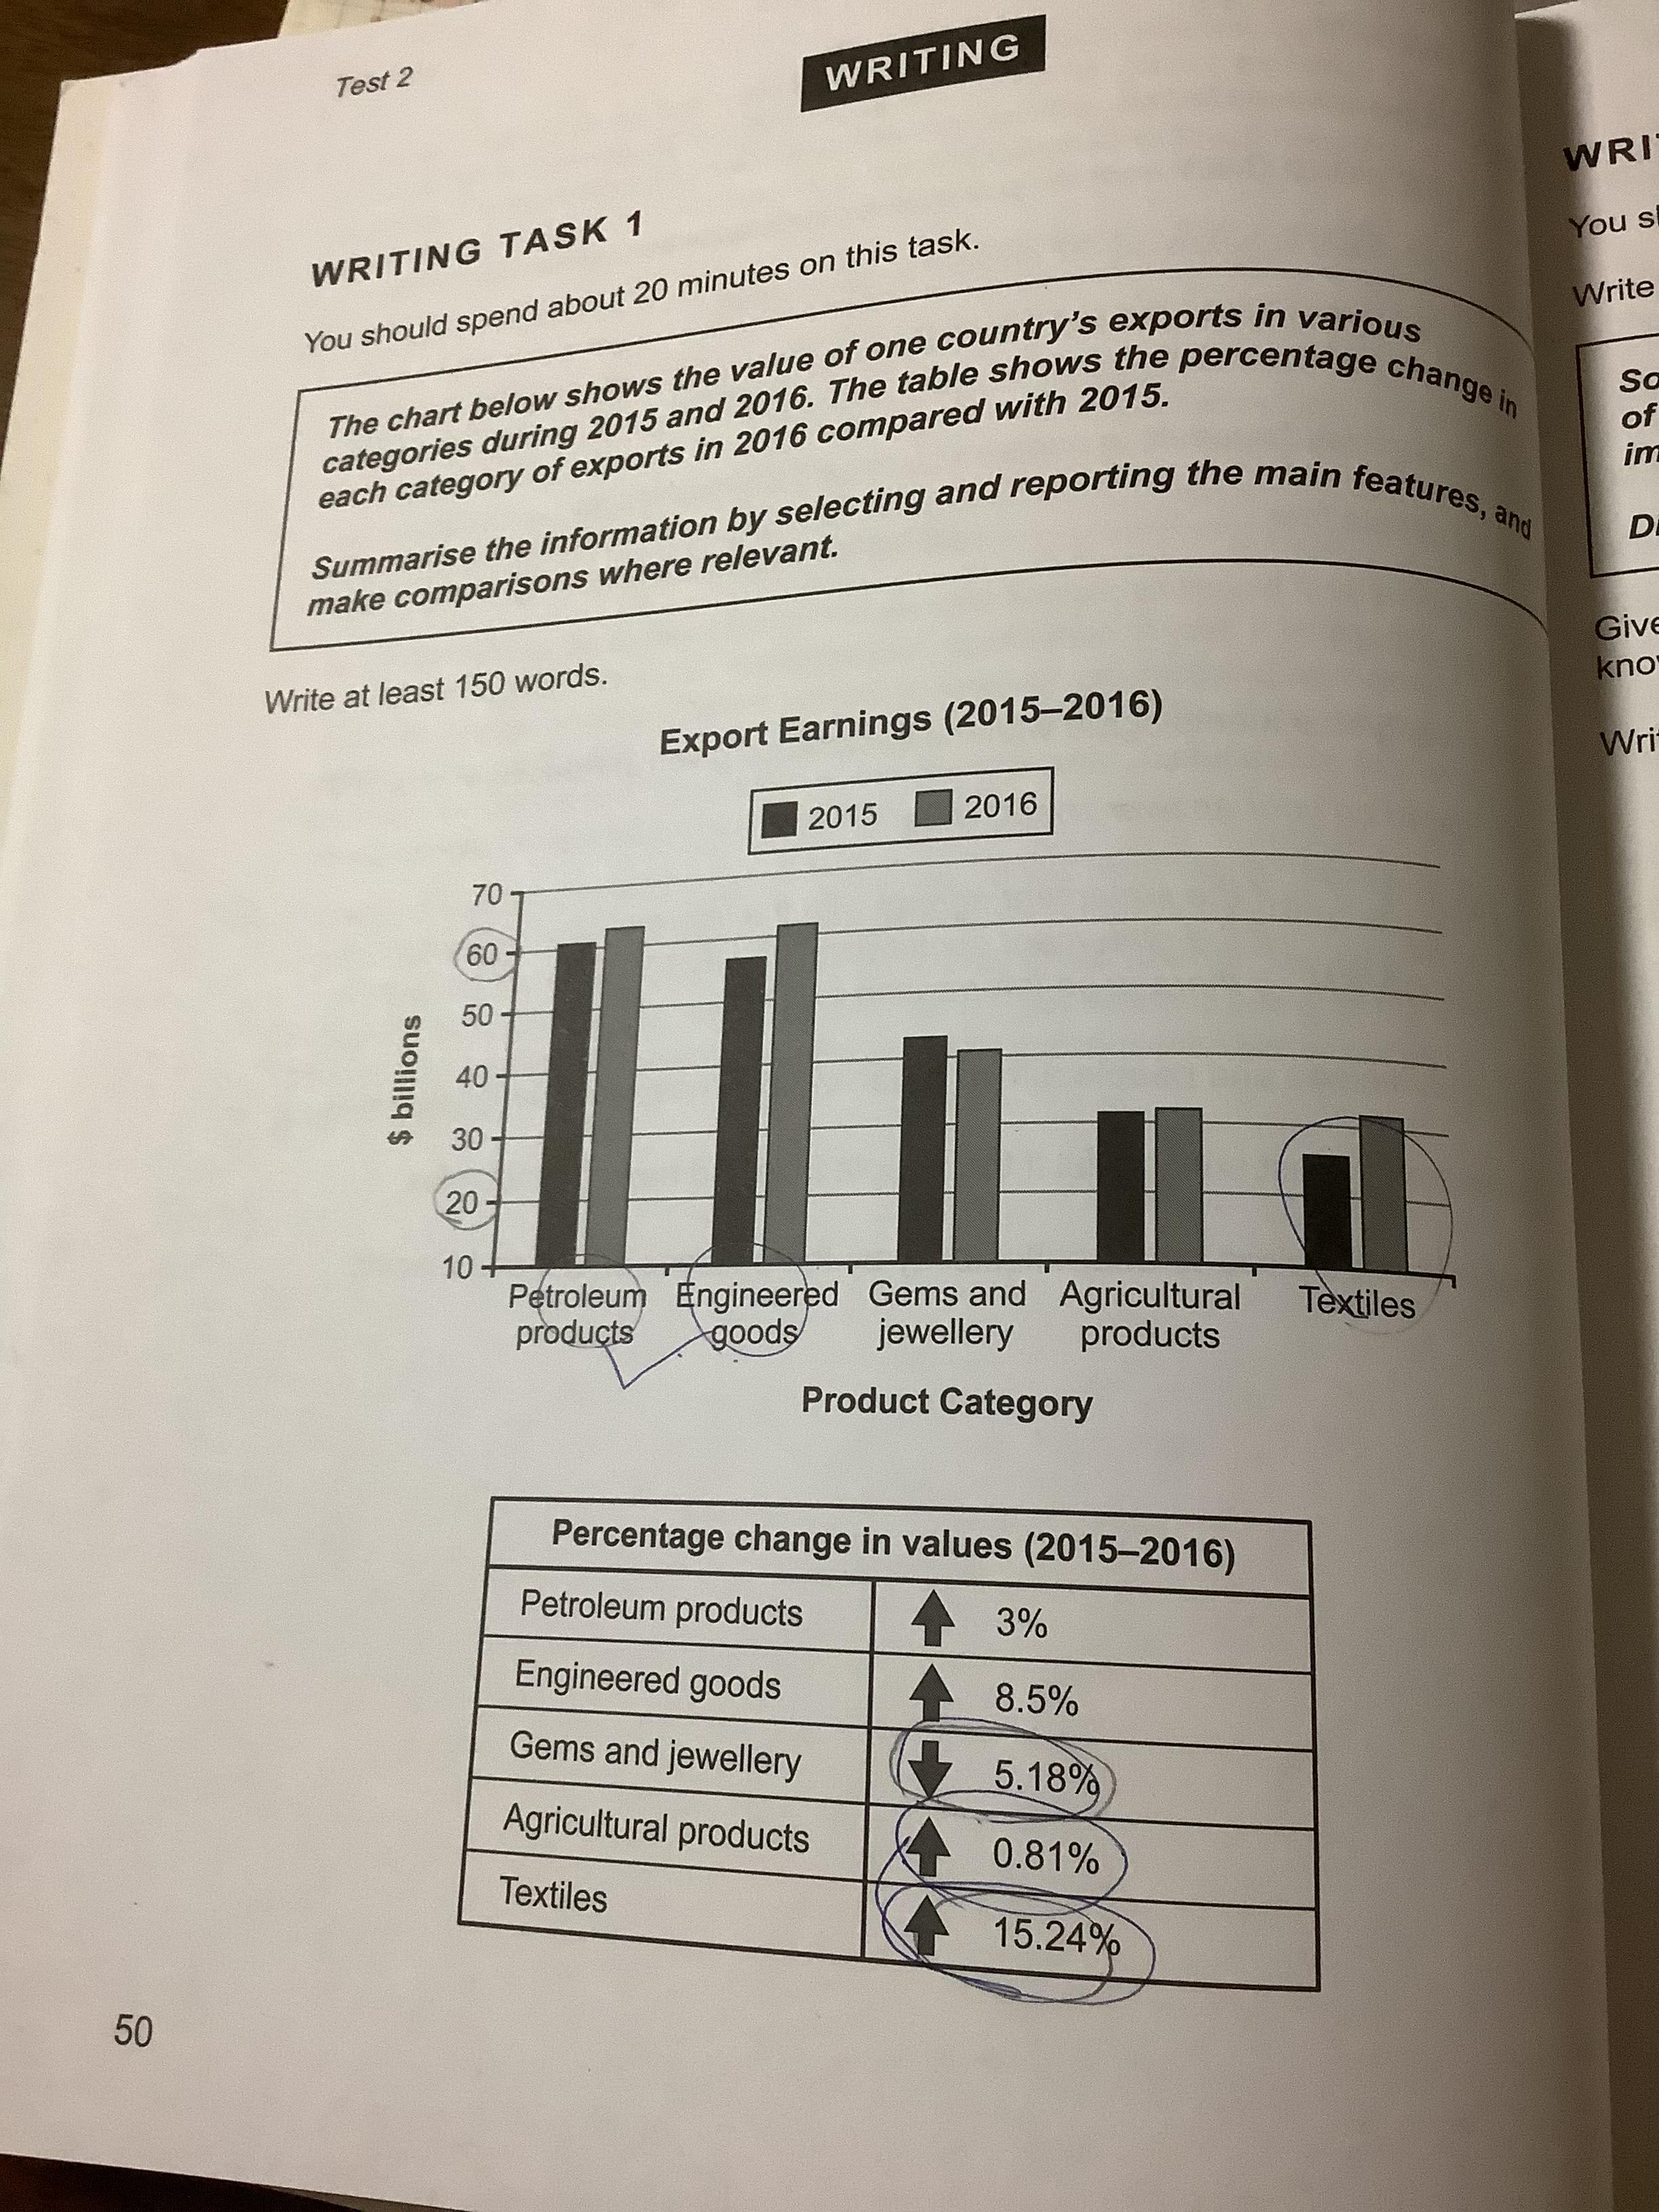
The graph and table show changes of the value and percentage in one country’s exports between 2015 and 2016. Overall, most categories increased in value except gems and jewellery part.
First, the bar of petroleum products and engineered goods represents much larger numbers (첫 번째 표는 비율과 상관이 없습니다.) portions than other three parts that are higher than 50 billion dollars in both of 2015 and 2016. Agricultural products’s change of percentage is less than 1% which is the lowest rate among the categories. In 2015 and 2016, the exports of agricultural products remain around 30 billion dollars. On the other hand, gems and jewellery is the only one category that showed a decrease in export decreased in 2016 (5.18%). The biggest gap between the given period is textiles products. It gained over 15% which started about 25 billion and hit over 30 billion dollars.
To sum up, most categories gained profit in 2016 except gems and jewellery, and the value of petroleum products account for the biggest portion while textiles products is the smallest. (Task 1은 결론을 넣지 않습니다. Overview가 이 역할을 대신해요.)

 비밀번호 확인
 댓글 0개
댓글 0개


 불편사항 신고