


 인쇄
인쇄


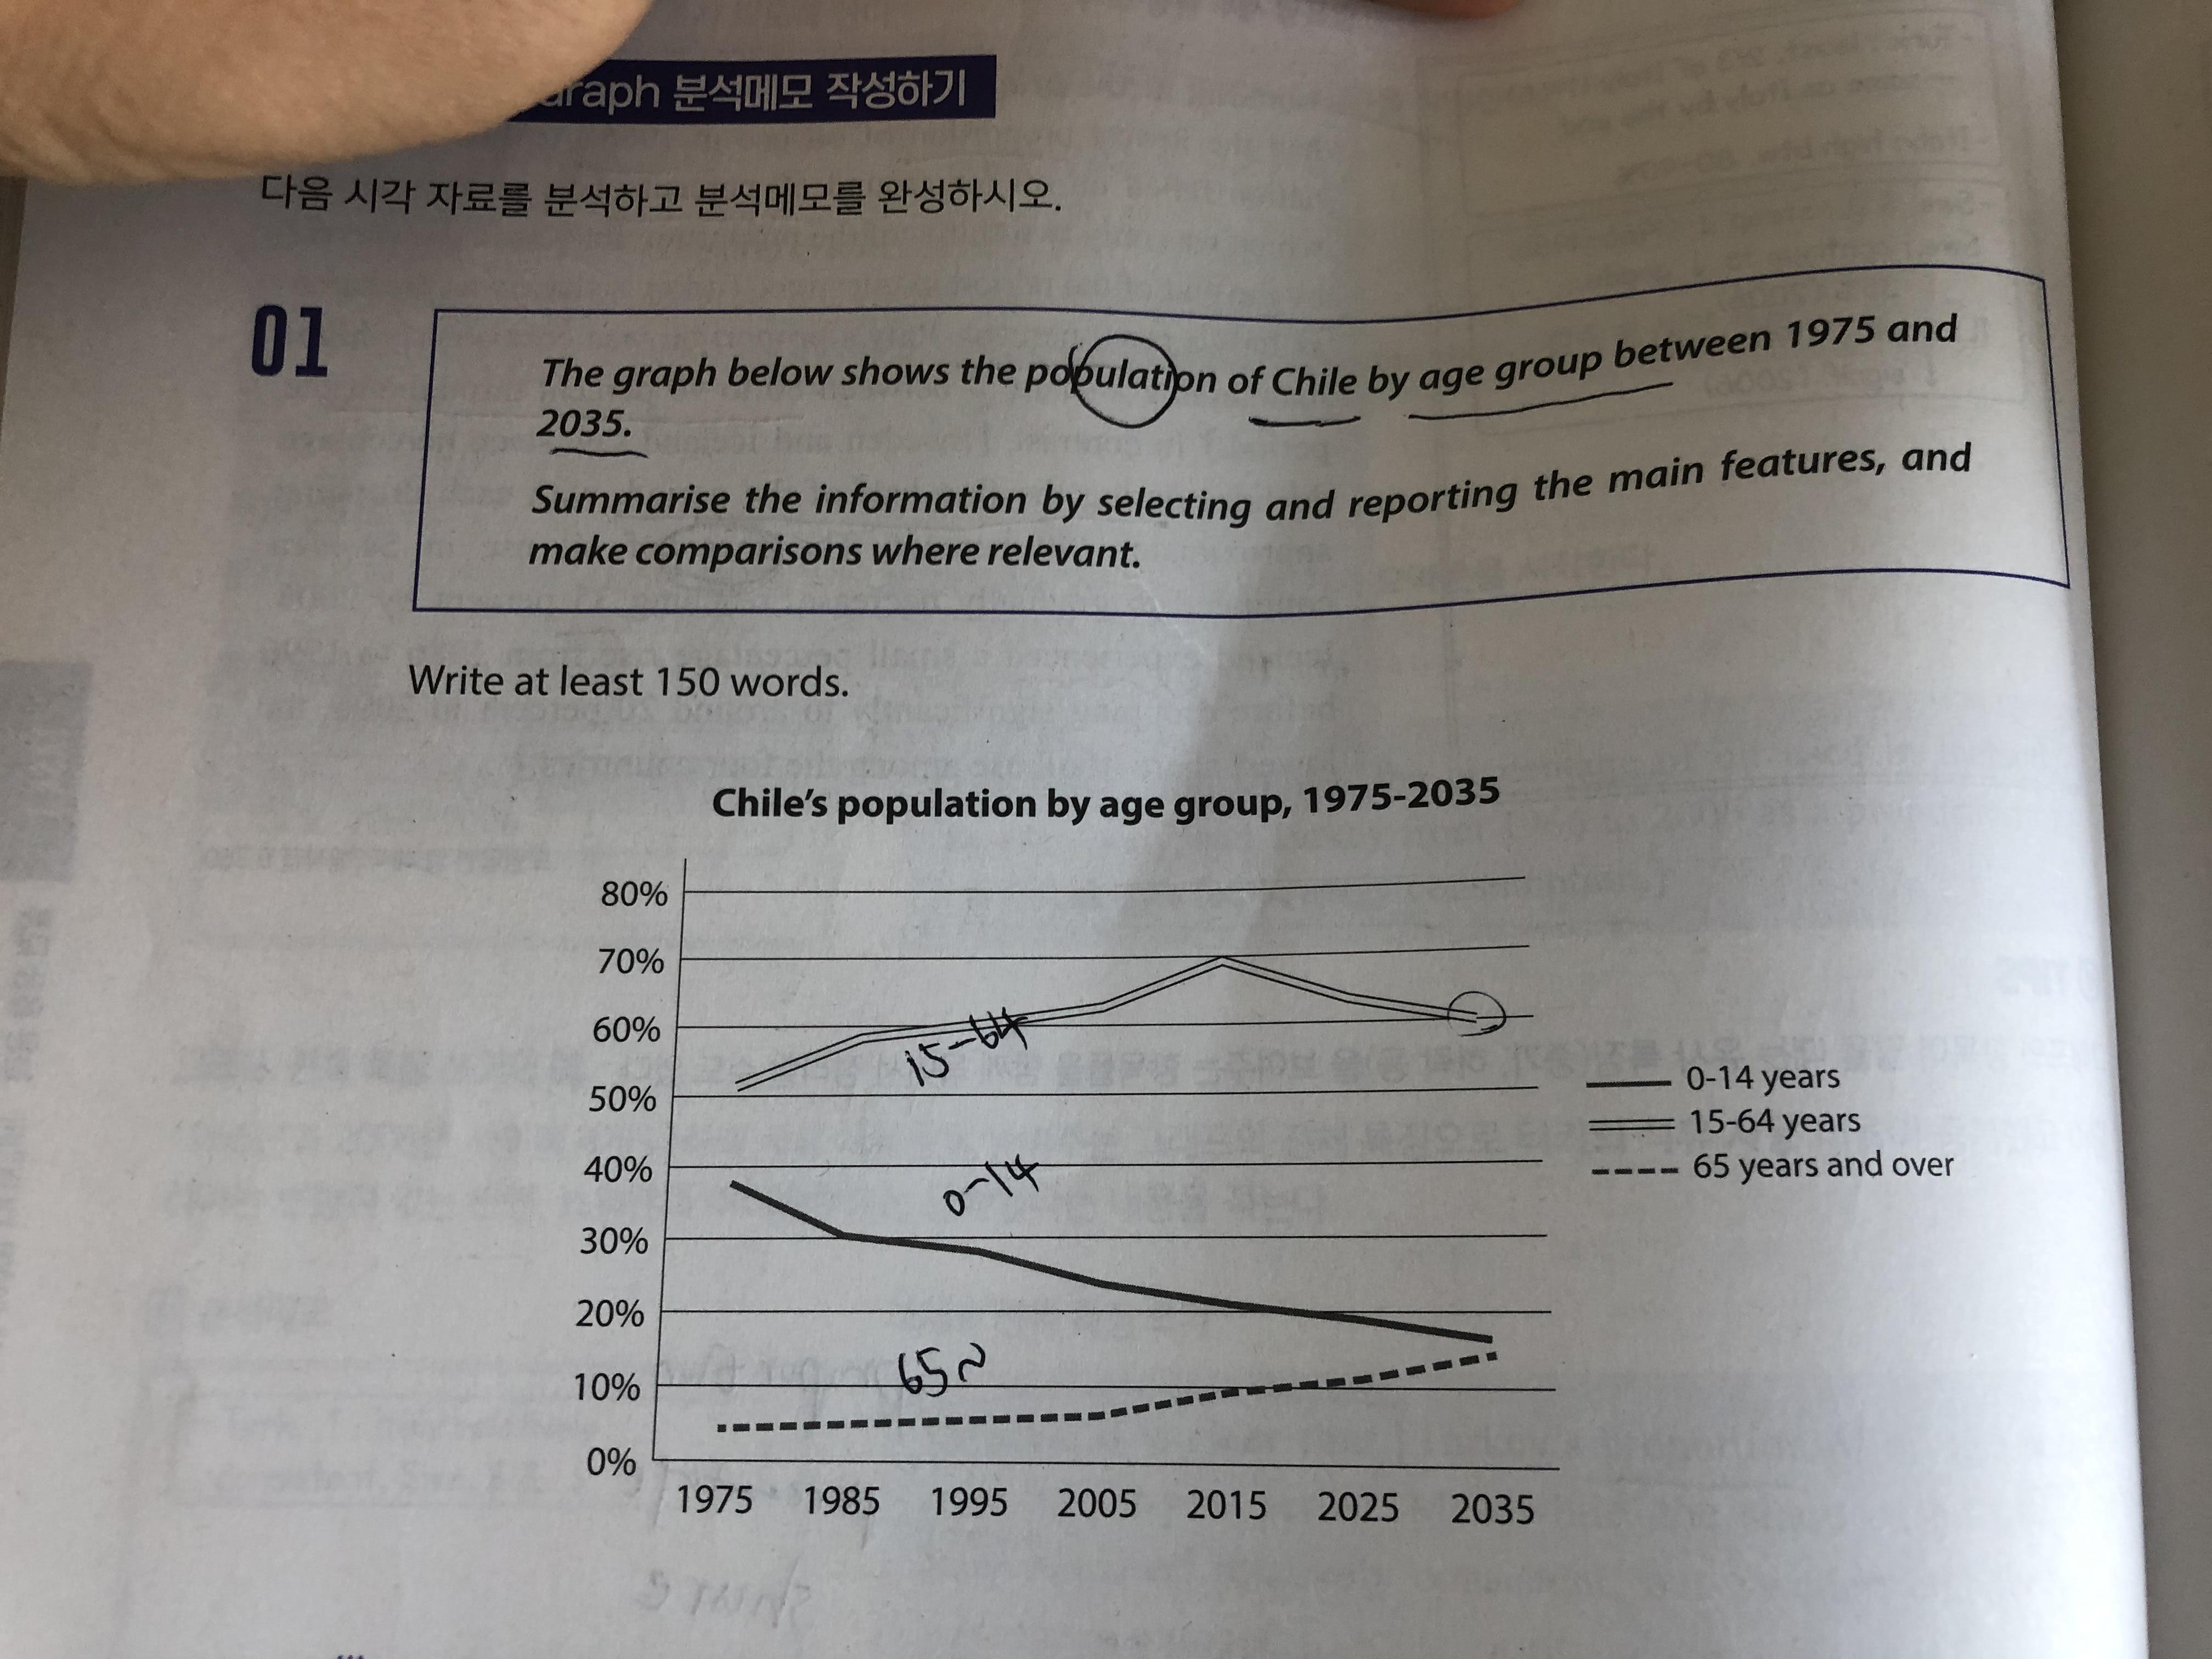
This graph
represents the proportion of citizens of Chile by three age groups, 0 to 14 years,
15 to 64 years, and 65 years and over from 1975 to 2035.
Overall, the rate of population over 15 years has an increasing trend. Whereas whereas, the figure of people under
15 years is decreasing. Furthermore, there is a definite order of the those 3
groups, in that proportion of people from 15 to 64 years is always the largest,
and the other 2 sectors are below that.
Looking at
the graph more closely, even though the figure of people of 15 to 64 years old had
been soaring up 70%, it started to decrease gradually since 2015 by 10% (지금은 수학 시간이 아니기 때문에 뺄셈을 하실 필요가 없지만, 굳이 빼야겠다 싶으면 퍼센트포인트를 붙여주시면 됩니다. 이에 대해서는 총평에서 말씀드릴게요.). As for
people under 15 years old, portion of them in whole population kept declining
from 40% to below 20%. Furthermore, it is interesting that it is going to cross
with the group of people over 65 years old around 2035 at the point of 15%. In
contrast, as for the long as the sector of citizens over 65 years old, the percentage
is growing, especially since 2005 from 5% to 15%.
총평: (6/6/7/6) 6.5
sb님의 경우도 다른 학생들과 마찬가지로, Task2에 비해 task1이 많이 아쉬운 상황입니다.
우선 이 글은 미래의 자료도 같이 보이고 있습니다. 고로 시제를 구분해서 작성해주셔야 해요. 또한 퍼센트포인트의 경우는 밑의 링크에 잘 설명되어있으니 이를 참고해주세요!
수고하셨습니다 :)
https://www.gohackers.com/?c=ielts/ielts_info2/ielts_method&type=url&uid=486596

 비밀번호 확인
 댓글 0개
댓글 0개


 불편사항 신고