


 인쇄
인쇄


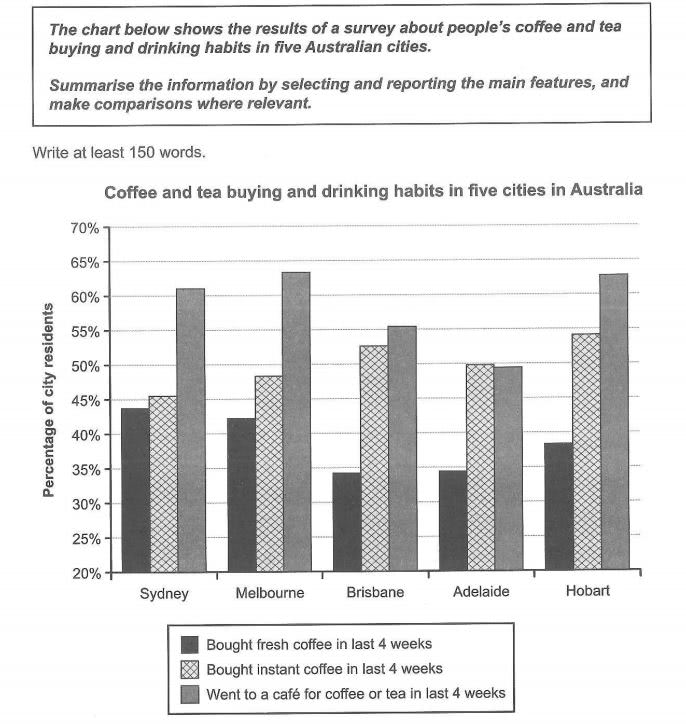
The given bar chart compares the proportion
of people’s habits about purchasing and drinking beverages in 5 different cities
in Australia.
It is clear that the most of the people in
the chart prefer to go to a café rather than buying fresh coffee or instant
coffee excluding people in Adelaide.
.Looking at the figures in Melbourne, more
than 60 percentage of citizens went to coffee shop while only about 40% of people
bought fresh coffee in last 4 weeks. By contrast, 50% residents of Adelaide purchased
instant coffee while less than 50% of citizens went to coffee shop to drink
coffee and tea. Surpassing the rates of people who visited café is special case
among the five cities.
Meanwhile, Sydney recorded the highest proportion
of people among the 5 cities when it comes to buying fresh coffee which is
about 45%. Otherwise, Brisbane has only about 35% of people who bought fresh
coffee.
1. 라이팅에서의 목표 점수 6.0
2. 다음 시험 날짜, 그리고 위의 점수를 아무리 늦어도 언제까지는 만들어야 하는지
이번주 토요일(26일) 하지만 다음 달 혹은 그 다음달에 또 칠 예정입니다
3. 현재 글을 쓰는데에 몇 분이 걸렸는지+단어 수+외부 도움(모범답안 필사) 등이 있었는지의 여부
혼자 썼고 25분 걸렸습니다 단어 수는 154자 입니다
4. 그 외 제가 알아두면 도움될만한 기타 정보나 현재 학생 여러분들의 공부 상황 등
혼자 공부하려니 너무 벅찹니다, 특히 라이팅이 뭘 써야할지도 모르겠고 정돈도 되지 않는 느낌입니다 ㅠㅠ

 댓글 0개
댓글 0개


 불편사항 신고