


 인쇄
인쇄


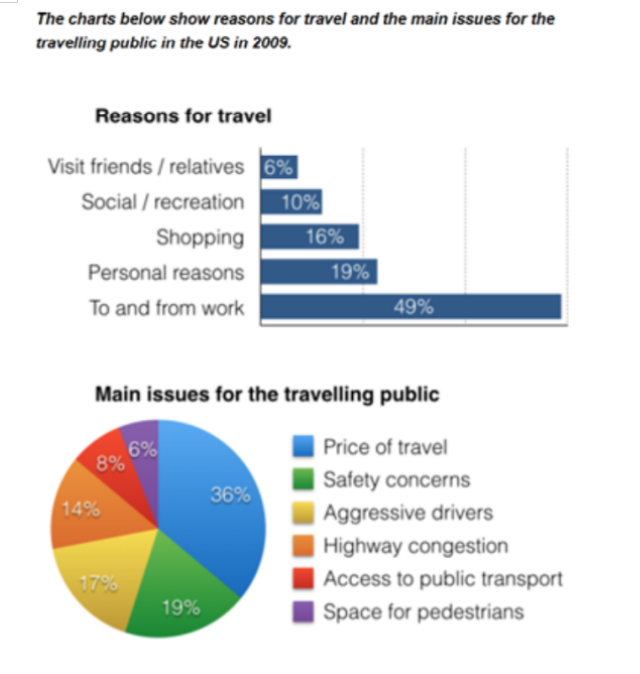
The given graphs describe the reasons for an American travelling in 2009, along with the six issues while travelling publics.
Overall, it seems that nearly half of the Americans travel to commute and the price of travel accounted for the largest portion of the main issue of travelling.
Looking at the graph more closely, one can see that the travel for work reason was the highest percentage, by 49%. It is followed by personal reason and shopping in sequence, 19% and 16% respectively. Visiting friends and relatives was the lowest rate of 6%. It is noticeable that, except for the commute, all the other reasons were under 20%. In the second pie chart, 36% of the people complained about the problem of price. Safety concerns, aggressive driver, and highway congestion have relatively similar ratio by 19%, 17%, and 14%. In 2009, 8% of respondents not satisfied with the accessibility to public transport. The lowest rate in the given chart was 6%, which was the complaint about the space for pedestrians.
wc:172
항상 감사합니다 :)

 댓글 0개
댓글 0개


 불편사항 신고