


 인쇄
인쇄


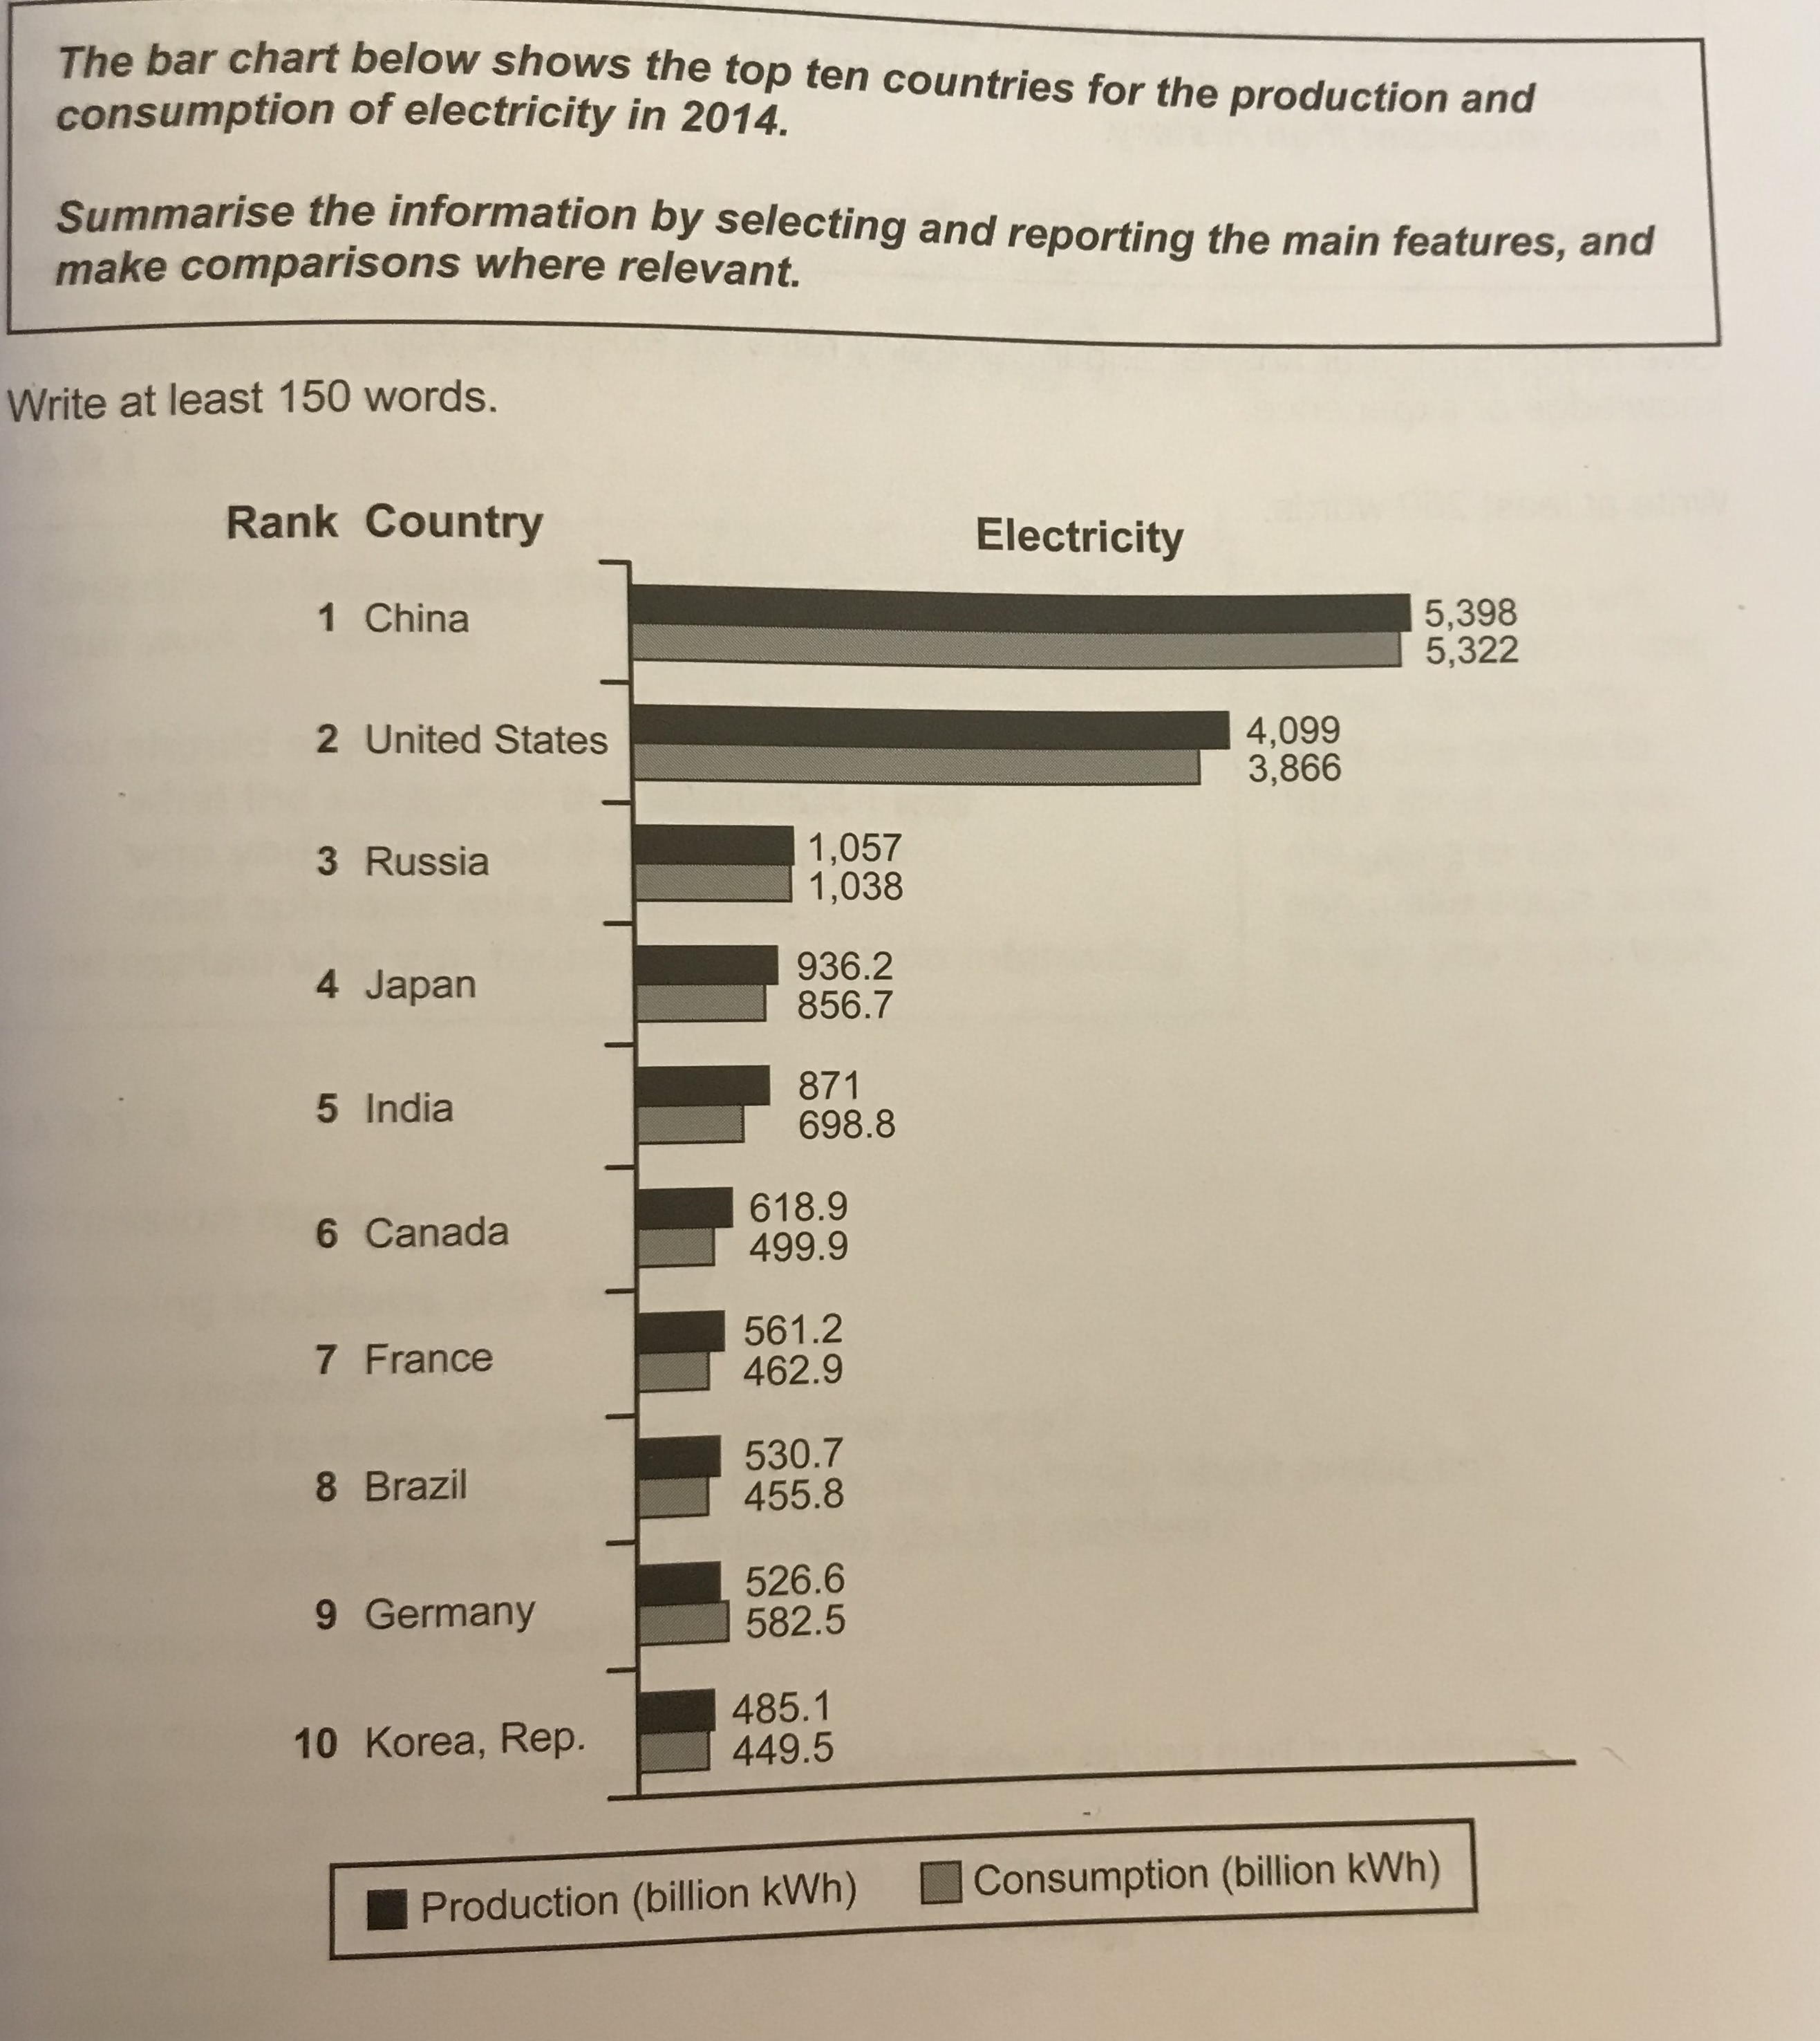
The bar graph illustrates the production
and consumption of electricity for the top ten countries in 2014.
Overall, it is clear that in the given ten countries of all rank
country, China had the highest production and consumption of electricity in
2014. In contrast, Korea, Rep. had the lowest consumption and production of electricity
in the same year.
Looking at the bar graph more closely, one
can see that China reached the top point of 5,398 billion kWh in the production
of electricity. Also, consumption of electricity was almost same as production
of electricity at 5,322 (여기도 단위를 갖춰주셔야 합니다.) in 2014. The second highest rank was The country with the second highest figure was the United States. There
was 4,099 billion kWh in production of electricity and the consumption of
electricity was 3,866 billion kWh. There was large gap between the production
and consumption of electricity in Russia, which was produce at produced 1,057 billion kWh
and consumed at 1,038 billion kWh, and the United States. The production of electricity
was 936.2 billion kWh, 871 billion kWh, and 618.9 billion kWh in japan, India,
and Canada, respectively. (이렇게 나열하는 것은 크게 의미를 갖지 못합니다.) Lastly, the lowest amount of electricity consumed was
Korea, Rep. at 485.1 billion kWh.
176 words 목표점수 6 입니다.
총평: (5/6/6/6) 6.0
이 표의 경우 핵심 중 하나는 바로 독일입니다. 독일만 유일하게 생산보다 소비량에 있어 더 높은 수치를 보이므로, 이러한 예외를 확실히 챙겨갈 수 있어야 해요. 표 문제에서는 항상 '예외' 에 주목할 수 있도록 신경써주세요!
수고하셨습니다 :)

 비밀번호 확인
 댓글 0개
댓글 0개


 불편사항 신고