


 인쇄
인쇄


1. 라이팅에서의 목표 점수
6.5
2. 다음 시험 날짜, 그리고 위의 점수를 아무리 늦어도 언제까지는 만들어야 하는지
시험본적 없음, 늦어도 21년 2~3월
3. 현재 글을 쓰는데에 몇 분이 걸렸는지+단어 수+외부 도움(모범답안 필사) 등이 있었는지의 여부
20분, 183단어
4. 그 외 제가 알아두면 도움될만한 기타 정보나 현재 학생 여러분들의 공부 상황 등
독학중입니다. 라이팅 1,2 한달정도 목표로 템플릿 및 빈출어휘에 집중하려고 합니다.
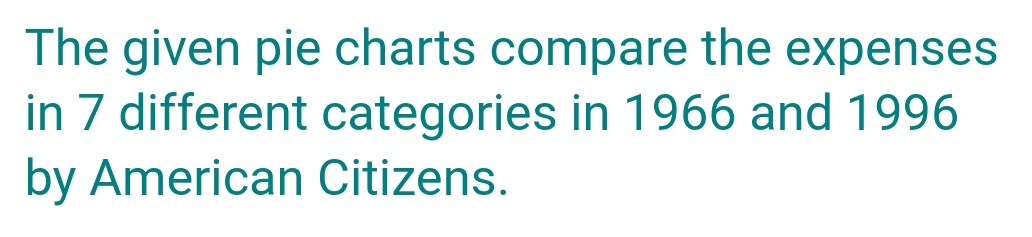
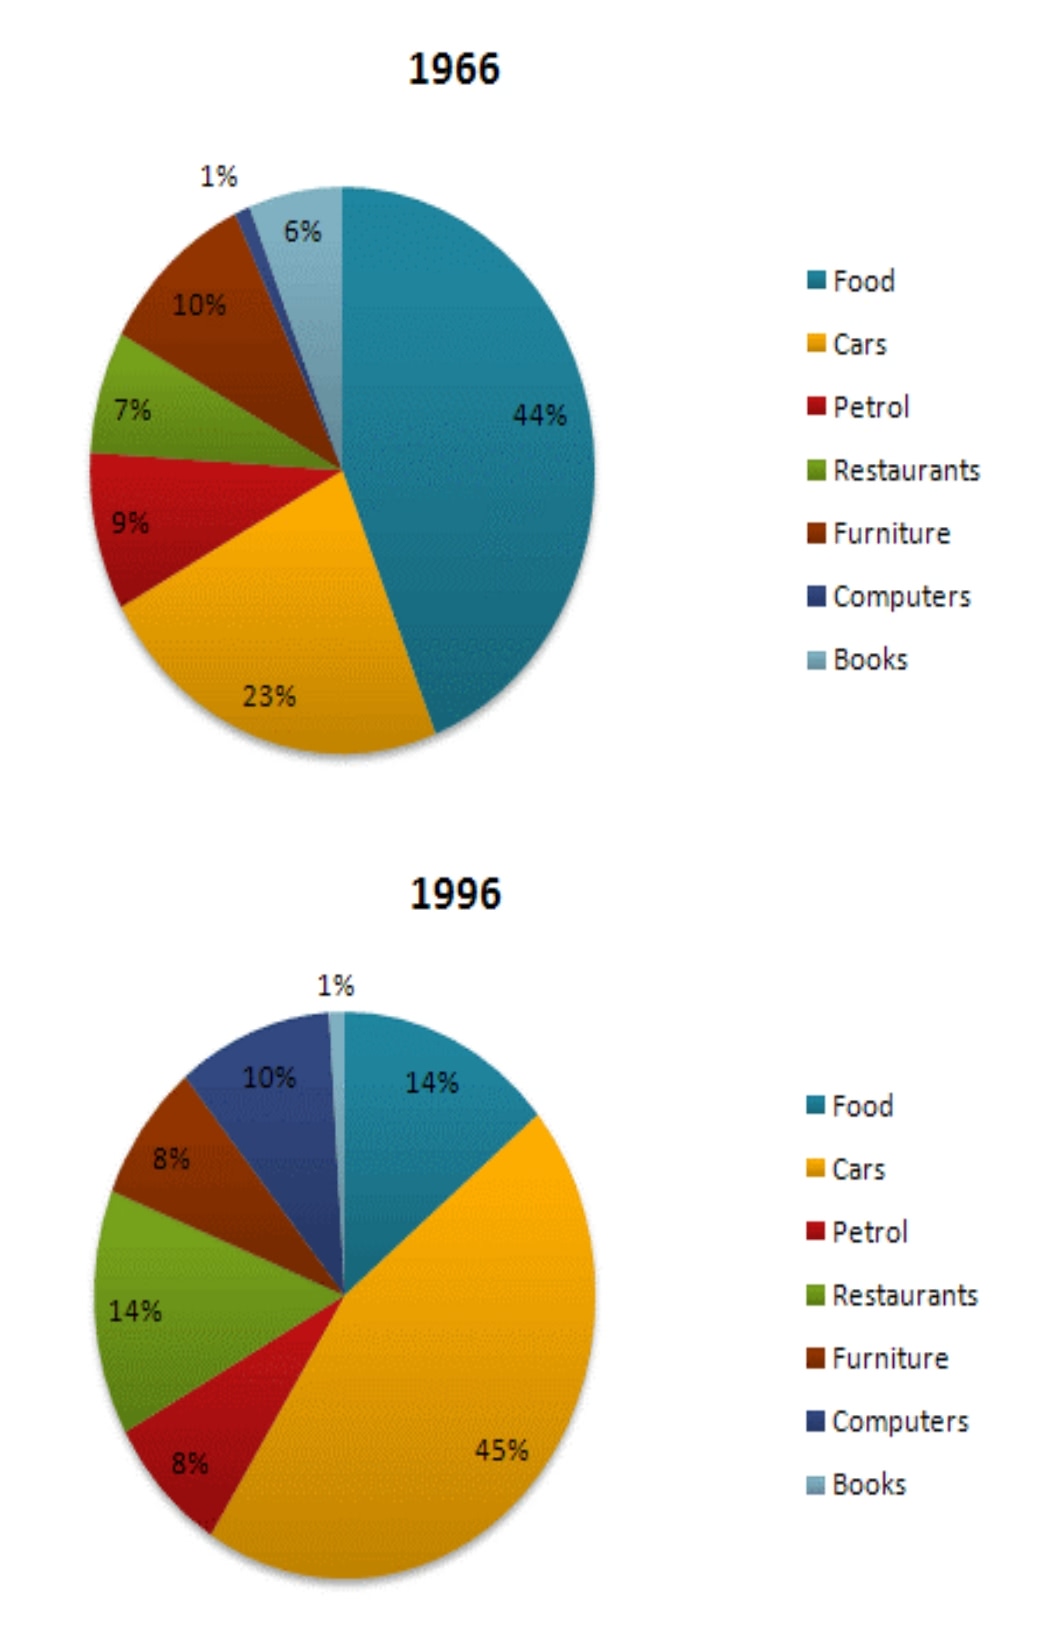
The given pie charts illustrate the expenditure on the seven types of categories between 1966 and 1996 by the U.S. citizens.
Overall, considerable changes can be seen in food and cars which had high figures in both data, and computers had the biggest increase in terms of the rate.
Initially, in 1996, the food category showed the most conspicuous rate than that of others. The rate of food used to have a few less than half which was followed by that of cars which was nearly a quarter. Interestingly, the total sum of the remains that expect for cars and food was only able to slightly over a third.
Thirty years later, computers' rate increased tenfold which was a remarkable growth than that of others. Moreover, there was a noticeable expense in the category of cars which occupied more than the rate of food in 1996. However, in stark contrast, food and books rates dropped dramatically more than three times. Lastly, it was the category of petrol and furniture that had only small changes that both became the same percent in 1996.

 댓글 0개
댓글 0개


 불편사항 신고