


 인쇄
인쇄


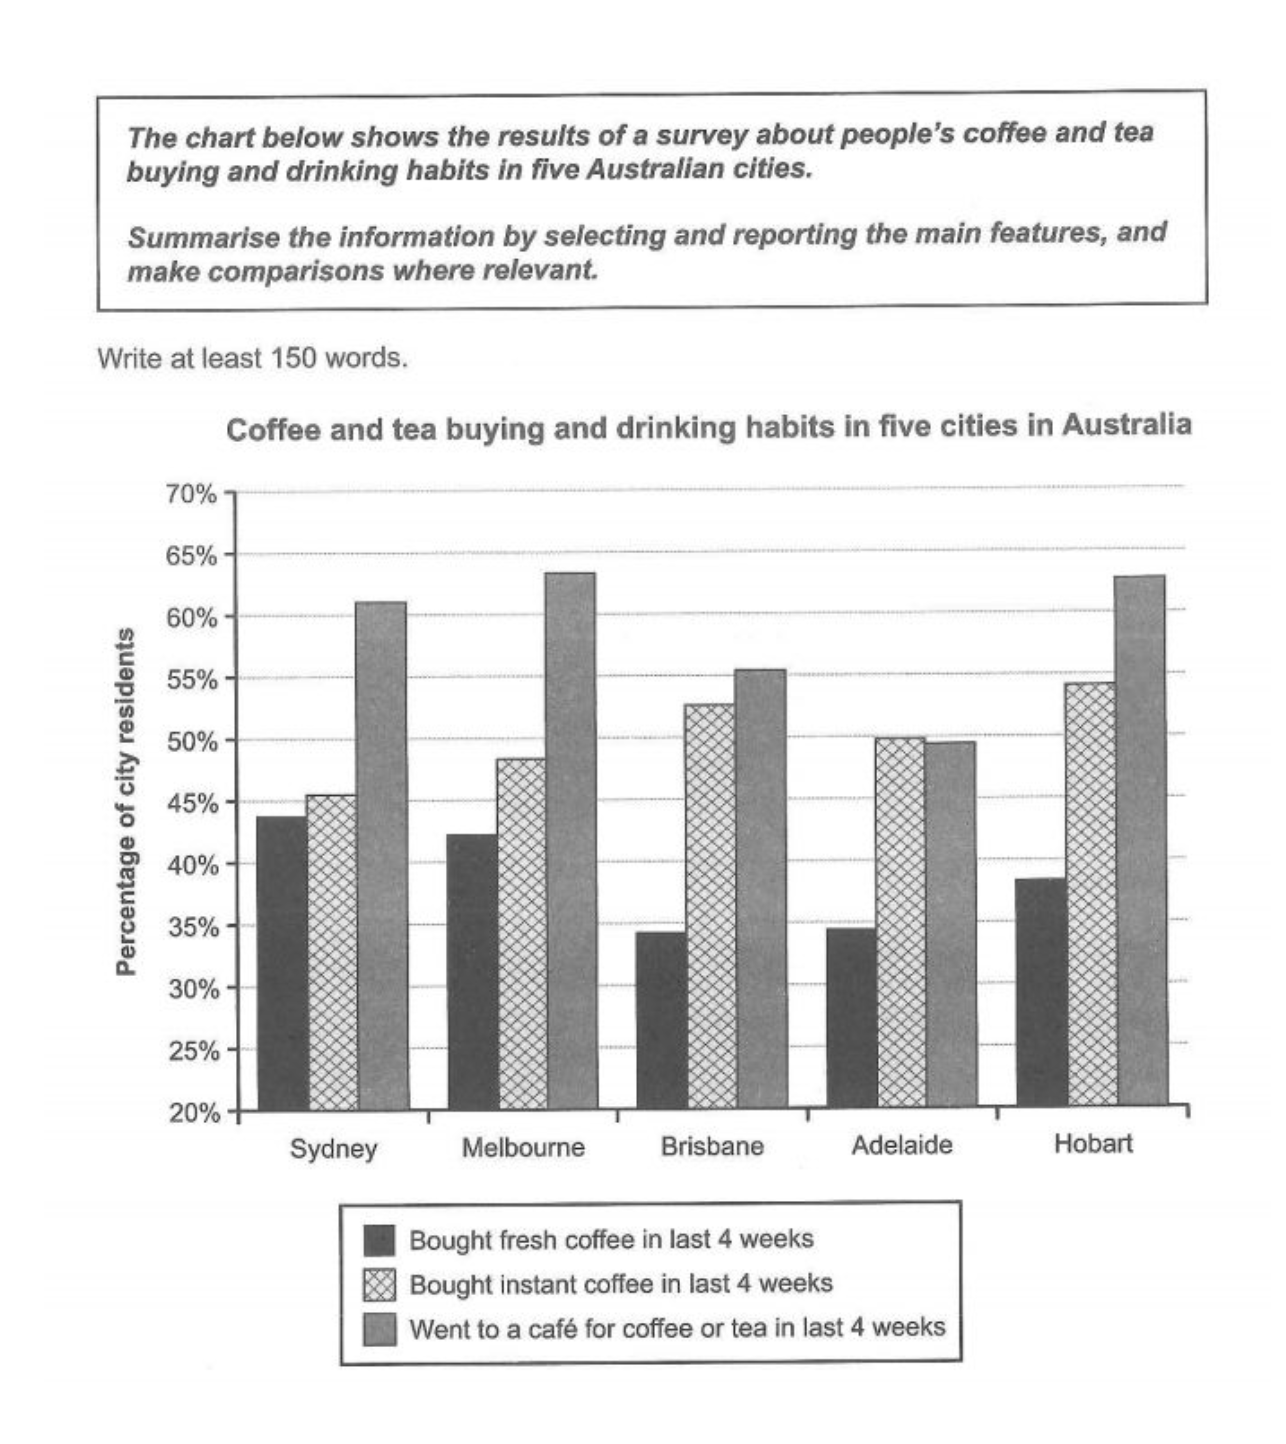
This graph chart illustrates how Australian people in five cities of Australia (이거랑 호주 사람은 전혀 다릅니다. 의미가 달라지지 않도록 신경써주세요!) have habits of drinking some coffee and tea within the last four weeks depending on specific period and is classified with five cities in Australia.
Overall, it is clear that the most of people were fond of going to cafes to drink coffee or tea during the past 4 weeks the most, in 4 of the 5 cities except Adelaide in some cities of Australia. Furthermore, in Sydney and Melbourne, the percentage of group who went to a cafe to get some coffee or tea was higher the highest than the others.
In further detail, half of people in Adelaide bought some instant coffee at 50 and this is similar as those in the same city that them who went to a cafe to get tea or coffee in a last month with 49 percent. With regard to some cities of Brisbane, Hobart and Adelaide in Australia, there are more than 30 percent of group who bought fresh coffee in a last month, but it is the lowest proportion compared to others.
총 154단어
20분
총평: (6/6/6/6) 6.0
분석이 그렇게 잘 되었거나 문법이 완전히 깔끔한 상황은 분명 아닙니다. 그러나, 지금 당장은 그게 중요하지 않아요. 오히려 이전에 문제되었던 구조 관련이 어느정도 해결된 게 제일 긍정적입니다. 대략 이렇게 잡아주시되, 여기서 Overview가 더 간추려지고 세부 분석이 더 추가되면 금상첨화입니다.
수고하셨습니다 :)

 비밀번호 확인
 댓글 0개
댓글 0개


 불편사항 신고