


 인쇄
인쇄


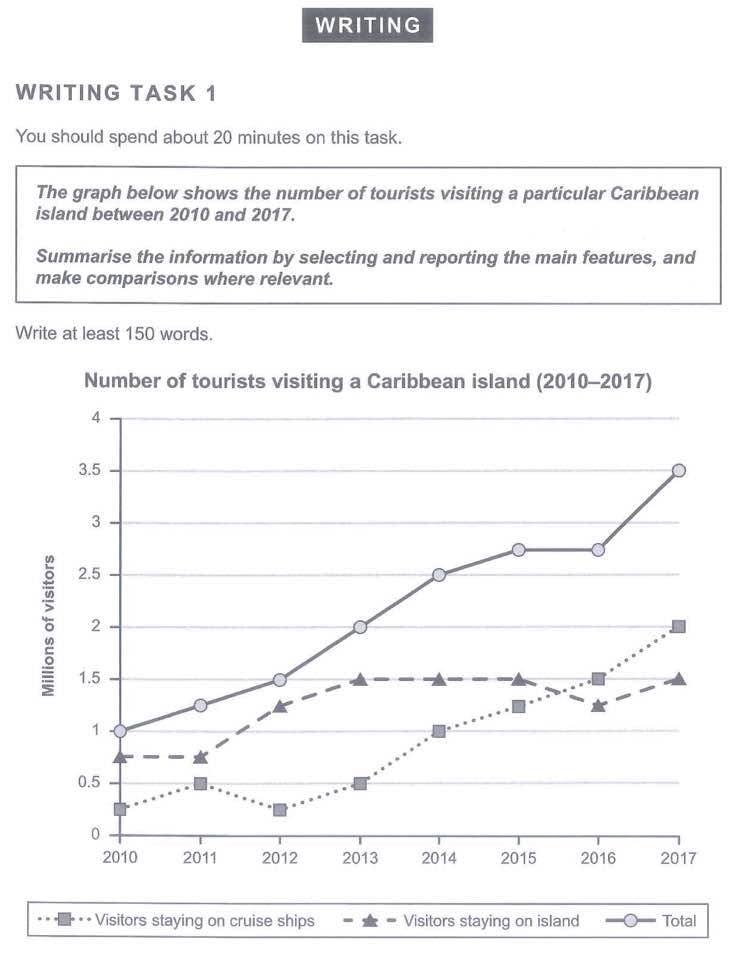
The given line graph illustrates the number of tourists visiting a particular
Caribbean inland from 2010 to 2017.
Overall,
it is evident that the number of visitors who stayed on cruise ships and on a
island increased between 2010 and 2017. Especially, the total figure was the
highest during the given period.
Looking
at the line graph more closely, one can see that the amount of tourists stayed
on cruise ships was the lowest in 2010, and this fluctuated from 0.25 million
to 0.5 million until 2013. This figure considerably went up to 2 million to
2017. As for visitors stayed on a Caribbean island, this figure also grew from 0.75
million to 1.5 million between 2010 and 2015. Then, this figure went down and up,
so this remained 1.5 million in 2017. The total number of tourists visiting a Caribbean
island always rose from 1 million in 2010 to 3.5 million in 2017, but between
2015and 2016, the figure remained 2.75 million.
25분 걸렸습니다.

 댓글 0개
댓글 0개


 불편사항 신고