


 인쇄
인쇄


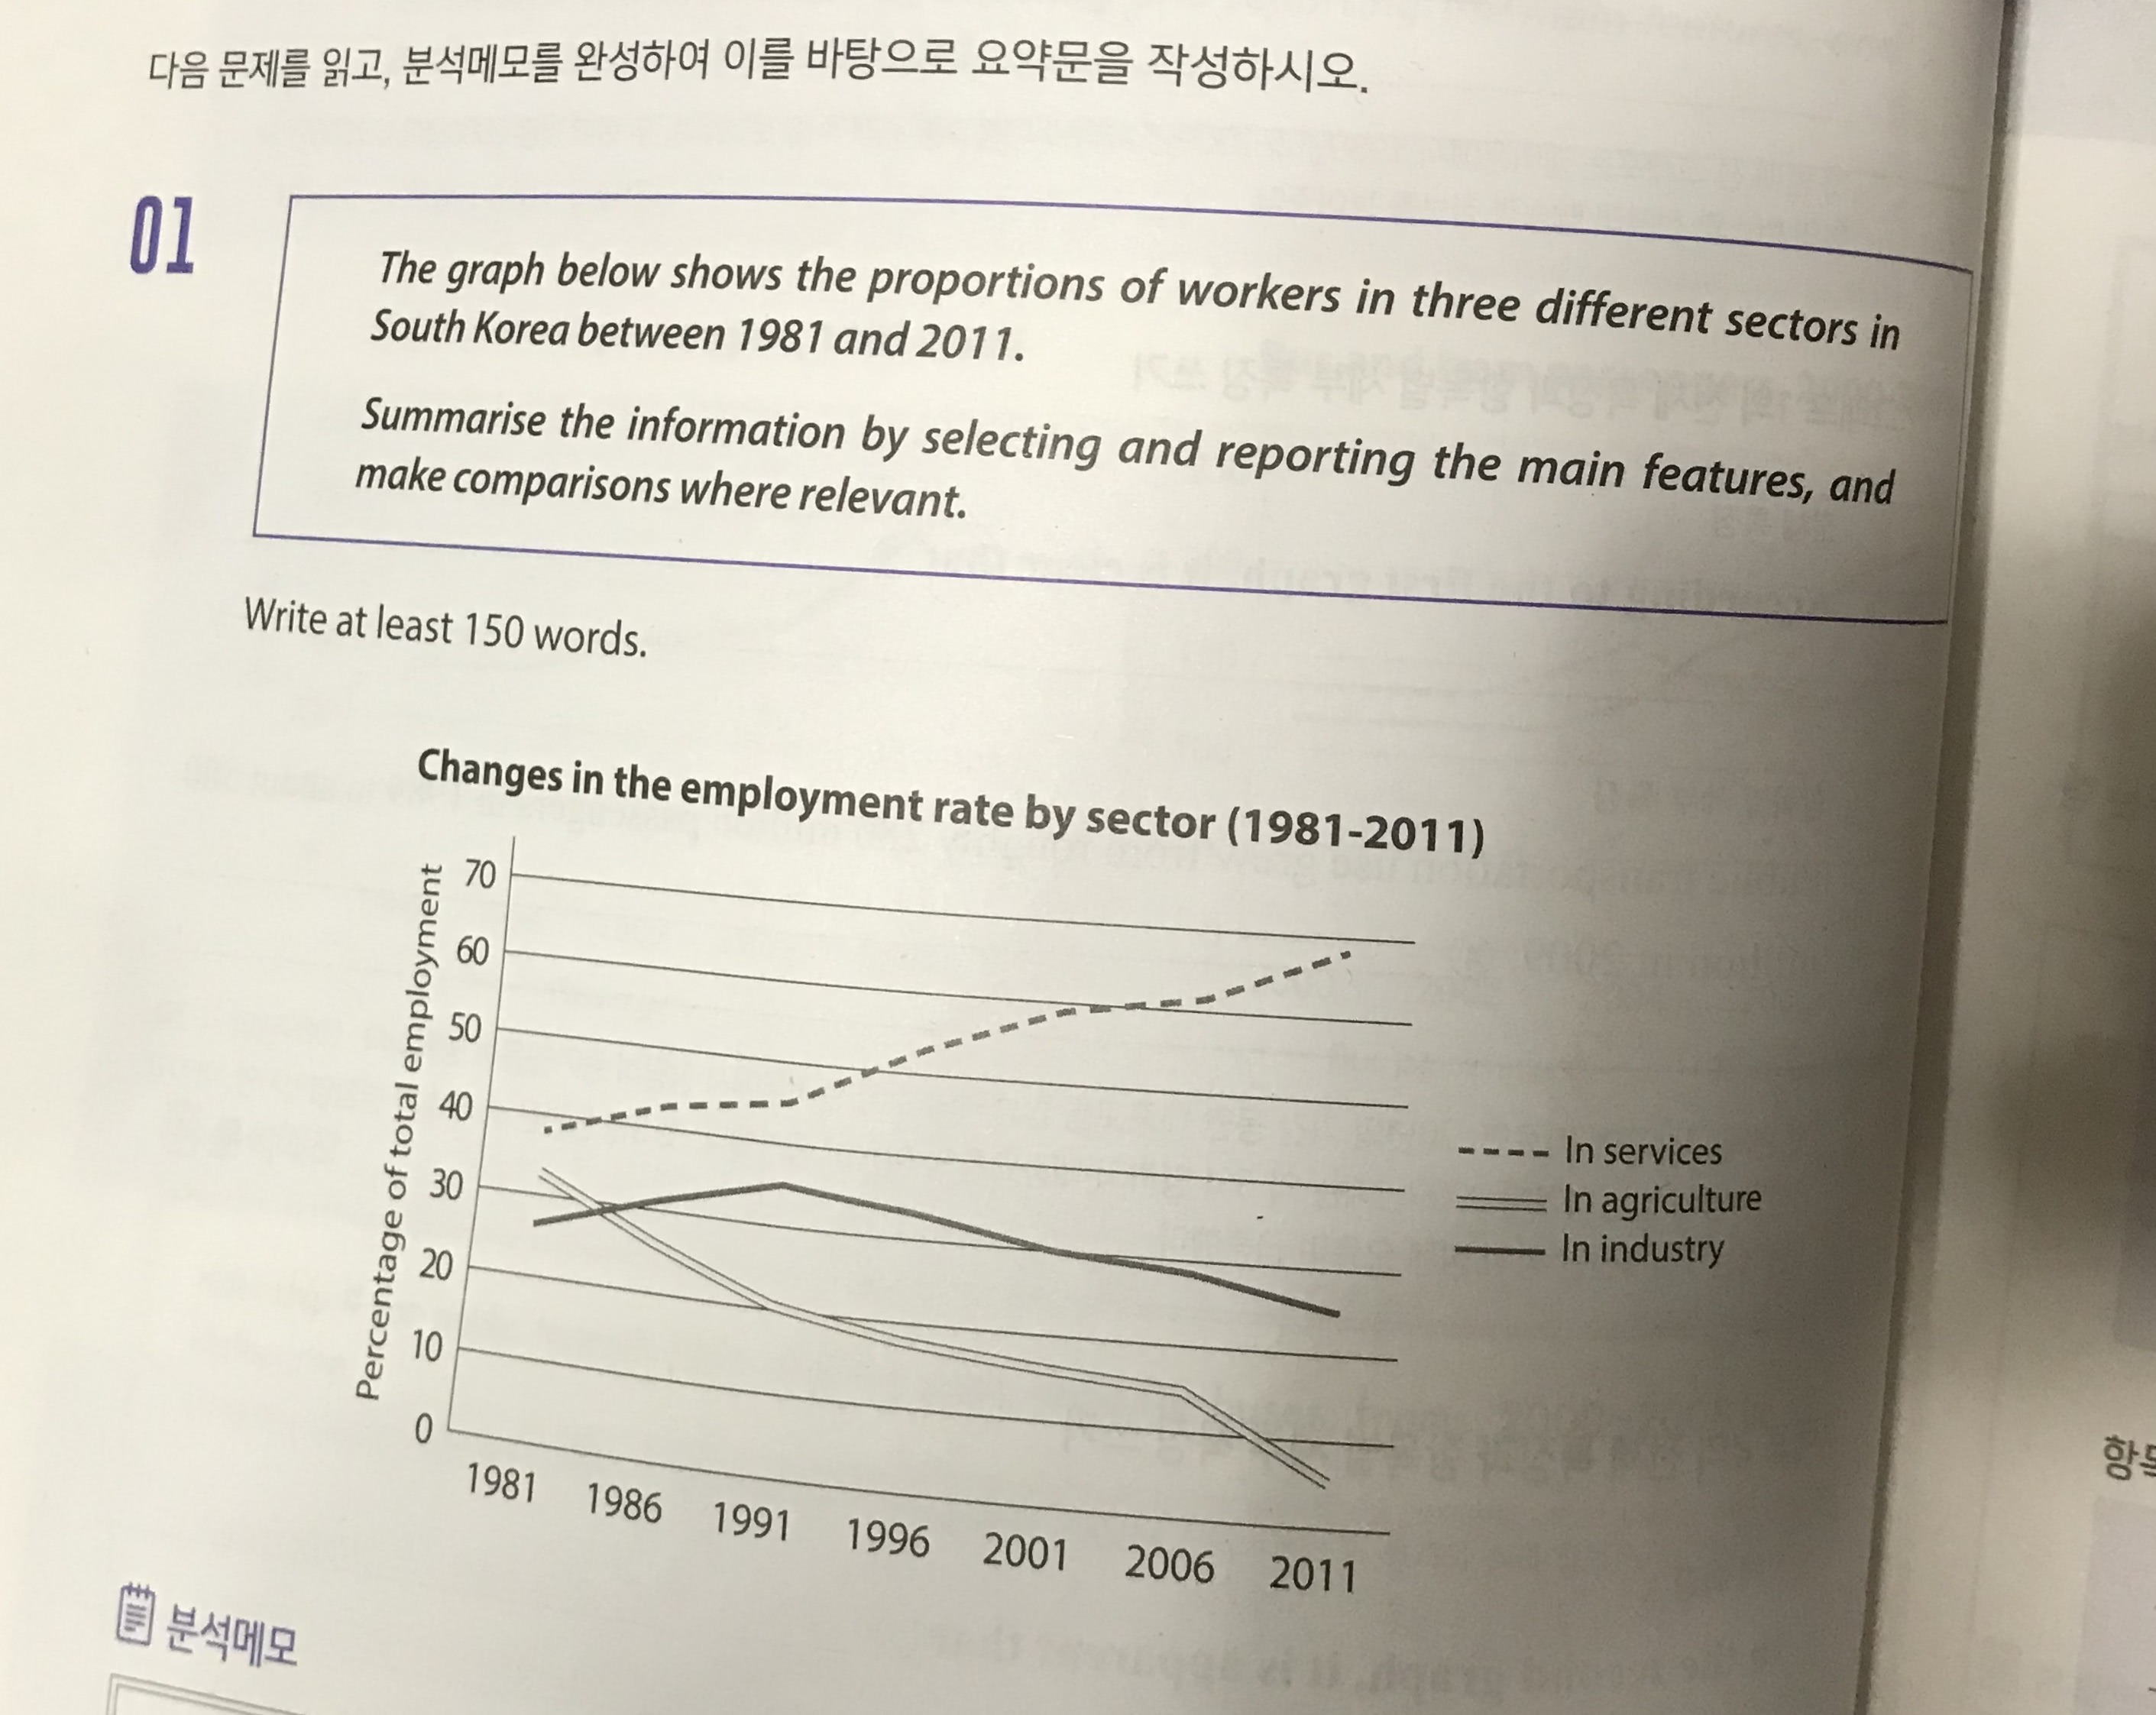
The graph illustrates the percentage of labor population in three types in South Korea from 1981 to 2011.
Overall, it is clear that there was significant increase in service. However, in agriculture and industry, there were decreasing patterns.
To see the graph more closer, one can see that the figures of services and industry inclined from 1981 to 2001. On the other hand, that of agriculture decreased significantly. From the year 1991, while the percentage of service surged more half of total employment, that of industry started to decline. Likewise, the proportion of agriculture dropped, hitting a low point of well under ten percent in 2011.
Finally, the trend will be maintained in the future. The sector of agriculture and industry will be less important.
단어 수: 125 소요시간 25분 목표점수 6.0
단어 수가 많이 모자른데 다른 피드백도 필요해서 올려봅니다..
2주내로 끌어올릴수있을까요?ㅜㅜ

 댓글 0개
댓글 0개


 불편사항 신고