


 인쇄
인쇄


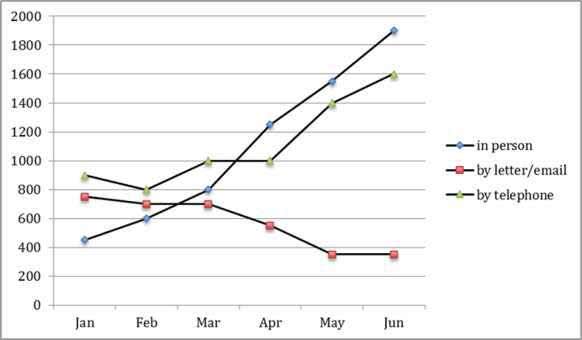
The given line graph illustrates how many people enquired the Tourist Information Office in certain city over a six-period in 2011.
Overall, it is evident that the number of enquires who used their telephone and via face to face have seen a raising trend during the given period. In contrast, the number of people who contact by letter or e-mail was the lowest in the same period.
Looking at the line graph more closely, one cans see that a number of enquires who get the information throughout a worker with face to face was the lowest, at approximately 450 on January in 2011. This figure increased abruptly at around 1,900on Jun in the same year, surpassing the figure which used by letter or e-mail and by mobile phone, during on February, March, April. Also, the figure of using their telephone fluctuated since January to March, which, however, rose to 1,600 on Jun in 2011. In contrast, the number of enquires who take an information by the Tourist Information Office in one city gradually decreased to approximately 380 on March in 2011, and this figure remained followed the next year.

 댓글 0개
댓글 0개


 불편사항 신고