


 인쇄
인쇄


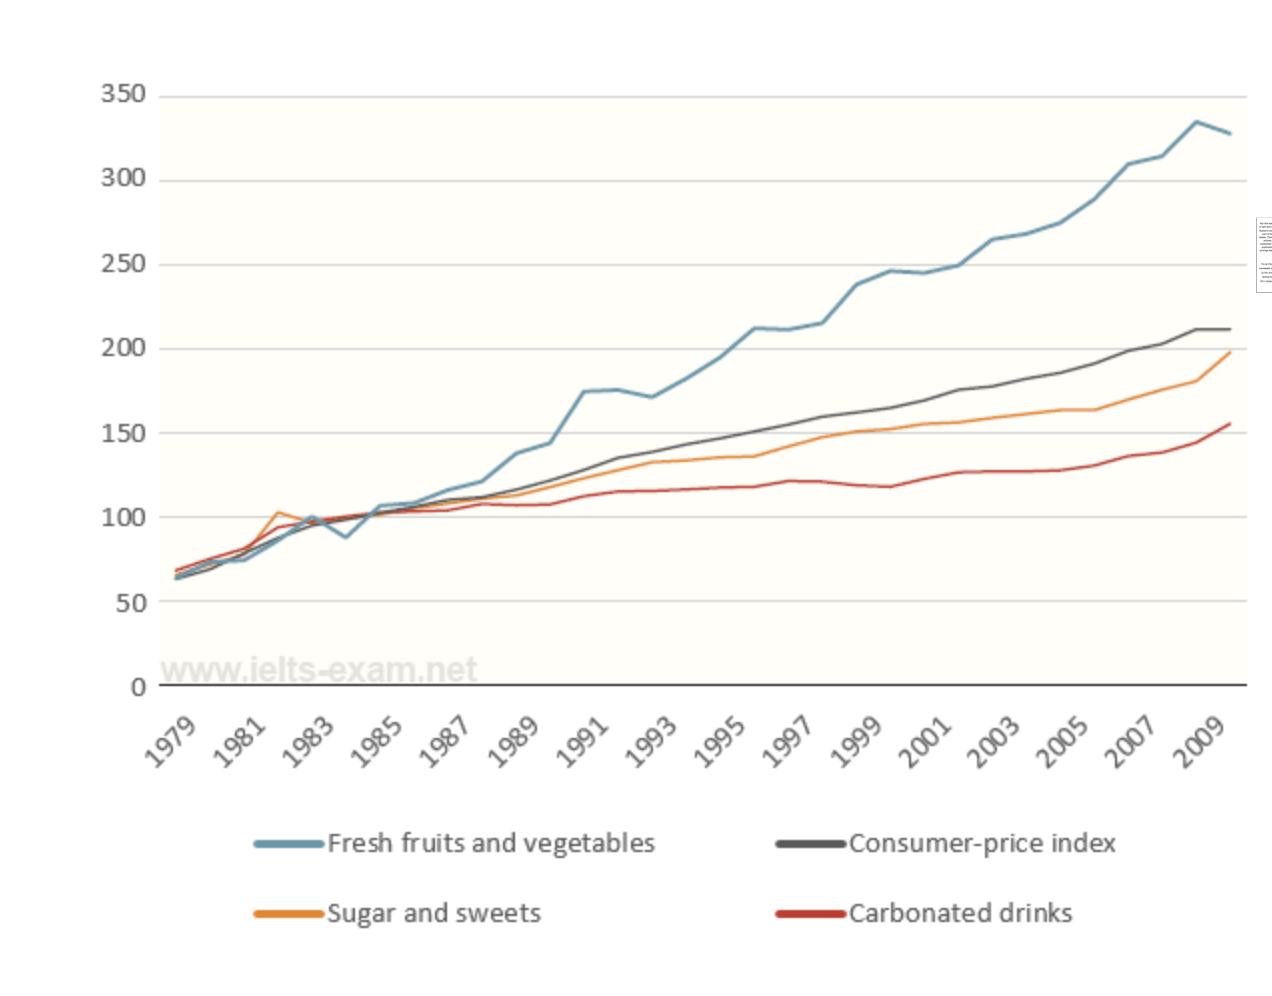
The graph illustrates how much 4 sectors(consumer-price index, fresh fruits and vegetables, sugars and sweets, and carbonated drinks)'s price changed from 1978 to 2009.
Overall, the rate (이 표는 비율과 아무런 관련이 없습니다.) of the whole segment increased continuously. Particularly the fresh fruits and vegetables' line rose explosively and repeated ups and downs trends.
First of all, the 4 parts were seen to have a similar price, which was almost 60 at the beginning of the period. The carbonated drinks which was the most expensive highest price at first showed the lowest increment in the year 2009, which was over 100. Then the second smallest at the end, the sugars and sweets, recorded a short upward trend and a downward trend as well., between 1981 and 1983. However, it was shown a static growth after that term to the latest year. Also, the line of the consumer-price index grew constantly in the whole period that was over 200 at the end of the period.
Secondly, the fresh fruits and vegetables that showed was the largest price in most of the period fluctuated at the starting period to the last period. (-----> 이 문장 관련해서도 비율은 싹 빼주시면 됩니다.) It was almost the lowest rate in the year 1979, but about 325 was were recorded at the current terms by the rate of the fresh fruits and vegetables.
글자수: 206자
시간: 20분
그래프가 다른때에 비해 단순해서 그런지 어떻게 분석해야하는지는 알거같은데 여전히 어떻게 써야하는지는 잘 모르겠네요ㅜㅜ
모델 답안을 좀 더 열심히 뜯어봐야겠어요ㅜㅜ
감사합니다!
총평: (7/6/6/6) 6.5
글 자체는 그렇게까지 크게 문제가 있는 건 아닙니다. rate정도에만 주의해주세요! task1의 상당수가 비율 관련 사항이기 때문에 학생들이 습관적으로 저렇게 쓰는데, 그러지 않아야 합니다.
개인적인 조언을 드리자면, 적어도 task1만큼은 지금처럼 인터넷에서 아무 표나 가져와서 양으로 승부하는 공부는 별로 좋지 못합니다. 그 이유는, 인터넷에서는 출처 불분명의 질이 낮은 표가 꽤 많이 돌아니는데, 이걸 공부하면서 오히려 학생들의 실력에 악영향을 주는 경우도 많아요. 당장 지금 표의 경우도 통계에 대해 별로 잘 아는 사람이 만든 것 같지는 않고, 그냥 문제 갯수 채우기 용으로 대충 만든 티가 납니다. 제일 중요한 단위에 대한 설명이 표에 전혀 없기 때문이죠. 인터넷에서 따오기보다는 그냥 C교재 등 검증된 교재를 하나 사서 해당 책의 표에 한해서만 천천히 풀어나가는 게 좋습니다.
그나마 백 번 양보해서 Task2는 인터넷에서 따와서 연습하셔도 되지만, task1은 절대 금물입니다. 절대로 양으로 때려박는 공부가 되지 않도록 주의해주세요! 중요한 건 아무 문제나 많이 푸는 게 아니라, 좋은 문제를 제대로 푸는 것입니다.
수고하셨습니다 :)

 비밀번호 확인
 댓글 0개
댓글 0개


 불편사항 신고