


 인쇄
인쇄


The line graph below shows the percentage of tourists to Scotland who visited four different attractions in Edinburgh. Summarize the information by selecting and reporting the main features, and make comparisons where relevant. Write at least 150 words.
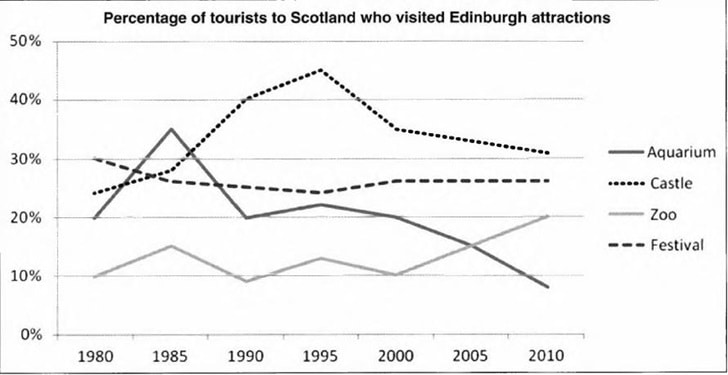
This line chart illustrates the proportion of travelers who visited four different attractions in Edinburgh of Scotland between 1980 and 2010.
Overall, it is clear that the three lines of groups who went to Aquarium, Castle and Festival (이거 포함, 항목들은 싹 다 소문자 시작입니다. 밑에도 다 바꿔주시면 돼요.)) in Edinburgh shown various changes on same period. Especially, the figure of group who visited a Festival is not moved between roughly 20% to 30% less 20% and over 30%. Conversely, the figure of Festival is almost the same stayed from 1980 to 2010.
With regard to these figures (너무 많이 쓰이고 있습니다.) which are Aquarium and Zoo, it does illustrate similar changes no matter what the period. In 1985 and 1990, two of them are improved and fell off to 20% and 10% each at the same time. However, this trend was has reversed in 2005.
In terms of other figures which are people that visited a Castle and Festival, the rate of the former was 30% (이 글을 읽으시는 즉시 percent와 percentage의 차이를 학습해서 정확히 익혀주세요! 영어 블로그 등에 잘 정리되어있습니다.) people who had on a trip for Festival in Edinburgh were 30 percentage in 1980 with the highest place, but, it is slightly decreased to nearly 25% and remained to 2010. On the other hand, in the latter other figure which is Castle, there were fluctuations on all of periods and also the top of the point in this line was 1995 that is the highest point in this graph.
시간 25분 (중간에 항목을 바꿔 써서 그거 고치느라 시간이 늘어났어요 ㅠㅠ)
총 204단어
라이팅 목표 6.5
총평: (6/7/6/5) 6.0
'시험장에서' task1의 항목의 대소문자가 헷갈릴 경우 에라 모르겠다하고 소문자 시작해주시면 됩니다. 그러면 90% 이상 맞아요. 물론, 연습 단계에서는 그런 거 없이 일일히 다 공부해주셔야 하고요. 이거는 제가 그때그때 체크해드릴테니까 mjkk님은 문법 공부를 최우선으로 해주세요!
수고하셨습니다 :)

 비밀번호 확인
 댓글 0개
댓글 0개


 불편사항 신고