


 인쇄
인쇄


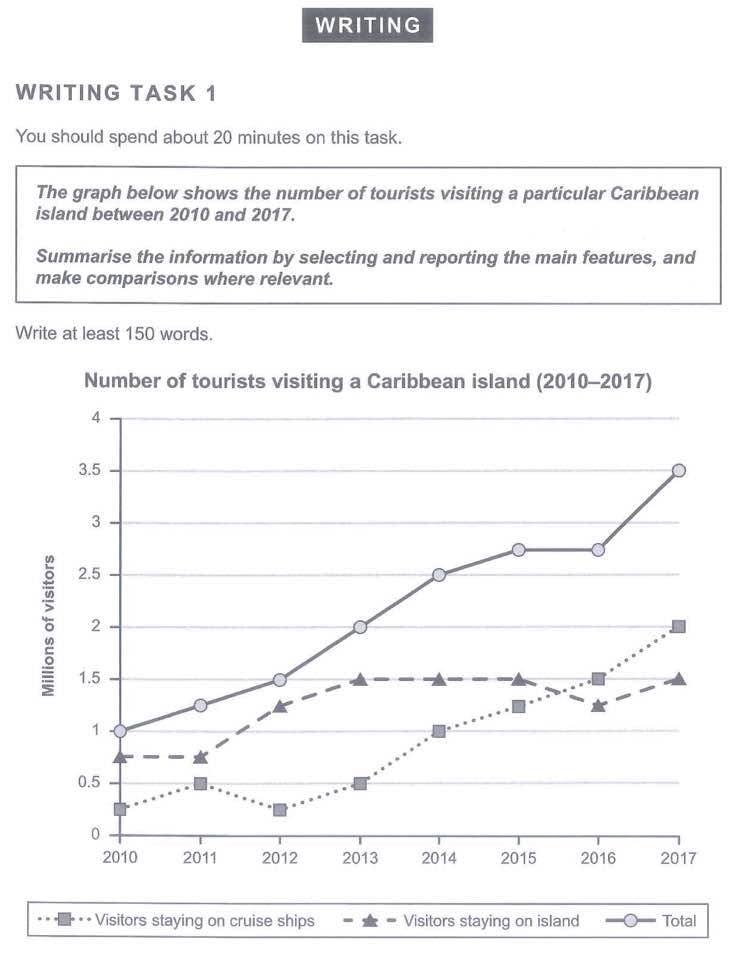
The given line graph illustrates the number of tourists visiting a particular
Caribbean inland from 2010 to 2017.
Overall,
it is evident that the number of visitors who stayed on cruise ships and on a
island increased between 2010 and 2017. Especially, the total figure was the
highest during the given period. (당연히 total figure가 제일 높습니다. 밑의 둘을 합친 숫자이니까요. 고로 이거 쓰는 건 의미가 없어요.)
Looking
at the line graph more closely, one can see that the amount of tourists stayed
on cruise ships was the lowest in 2010, and this fluctuated from 0.25 million
to 0.5 million until 2013. This figure considerably went up to 2 million to
2017. As for visitors that stayed on a Caribbean island, this figure also grew from 0.75
million to 1.5 million between 2010 and 2015. Then, this figure (3연타석 this figure~로 이루어져있는 상황이라, 별로 좋지는 않습니다.) went down and up,
so this remained at 1.5 million in 2017. The total number of tourists visiting a Caribbean
island always rose from 1 million in 2010 to 3.5 million in 2017, but between
2015and 2016, the figure remained 2.75 million. (얘가 먼저 나와야 합니다.)
25분 걸렸습니다.
총평: (6/6/6/6) 6.0
Overview에서와 같이, 당연한 말은 따로 쓰지 않도록 주의해주세요! 그리고 항상 전체와 부분이 있으면 전체가 먼저 언급될 수 있게 해주세요!
수고하셨습니다 :)

 비밀번호 확인
 댓글 0개
댓글 0개


 불편사항 신고