


 인쇄
인쇄


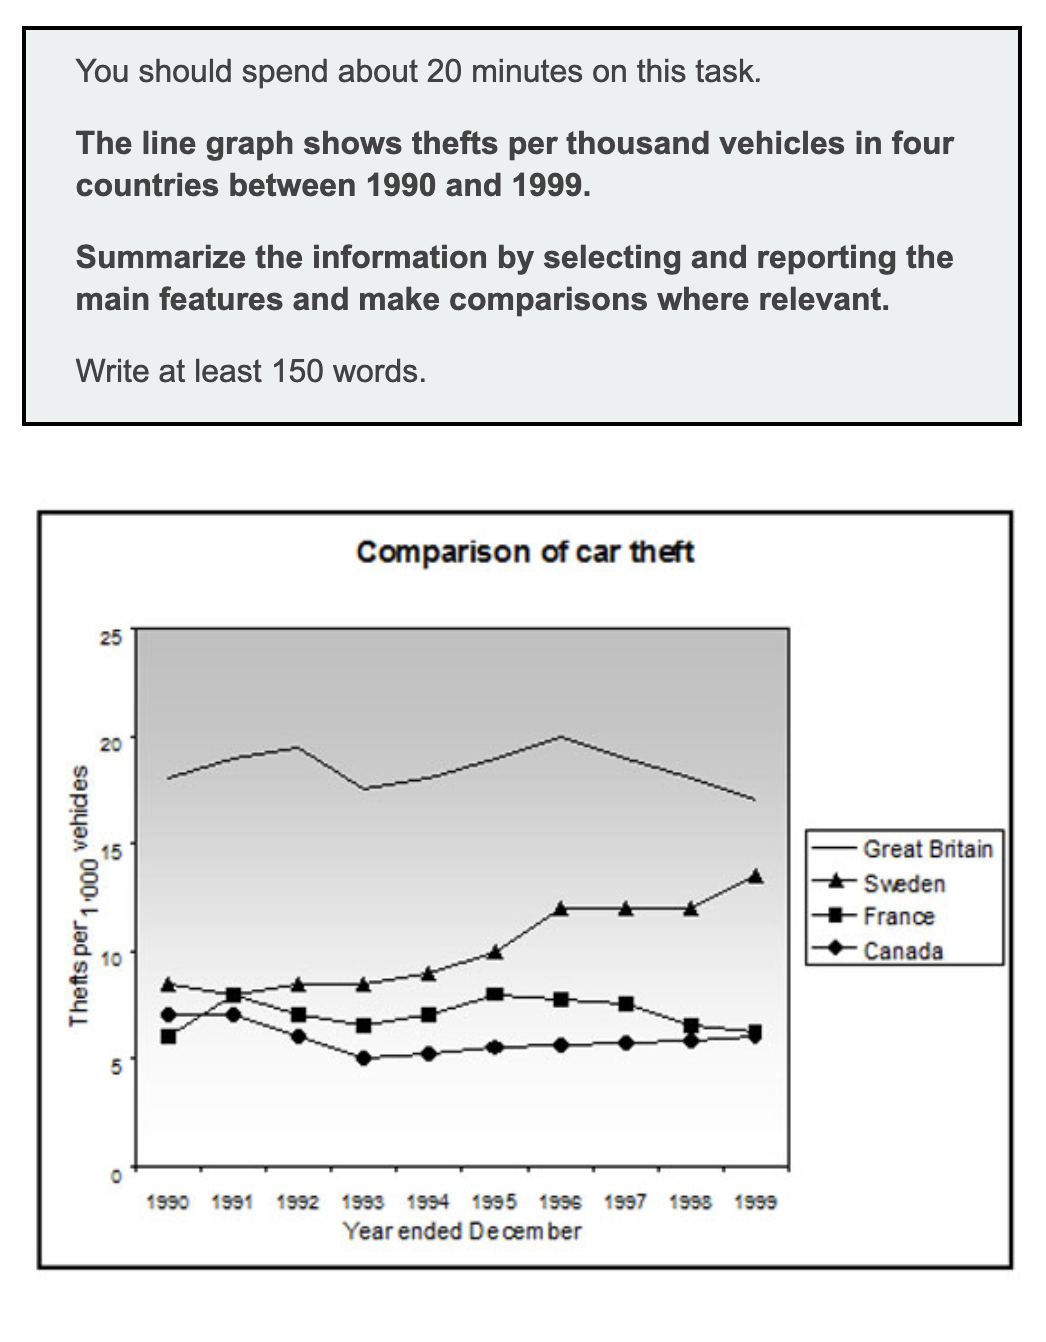
The line graph illustrates number of stolen cars per thousand in 3 European countries and Canada from 1990 to 1999. As an overall trend, the car theft in Great Britain is seen as the highest figure throughout the period.
In detail, the amount of robbed vehicles in Great Britain fluctuated from 1990 to 1996 with around 17 per thousand cars (지금 수치를 완전히 잘못 잡아주셨는데, 이에 대해서는 밑에서 말씀드리겠습니다. 참고로 다른데에도 다 이렇게 해주시면 됩니다.) average 17,000 stolen cars. It reached a peat at about 20,000 in 1996 and then gradually increased to around 16,000 until 1999 which was the lowest figure during the period. A similar variation trend was showed in France with its figure being at approximately 8,000 missed vehicles in 1990 and then varied over the following 5 years. After that, it dropped steadily by the end of the period.
In contrast, the Swedish car thieves robbed almost 3 times more car in 1999 than in 1990. The number of stolen cars started at about 6,000 in the first place, and it soared to about 13,000 within 6 years. After that, it remained the same for for 3 years and then peaked at just under 15,000 in 1999. (여기서 엔터 치지 않습니다. 엔터를 한 번만 치는 경우는 아예 없다고 보셔도 무방합니다.)
While the figure of Swedish thefts vehicles showed a threefold increase over a decade, that of French and Canadian thefts cars fell compared to 1990 and 1999.
204 words, 30 mins
혹시 분량이 많아지면 한개 파트를 아예 언급 안해도 되나요?
표바표라서 무조건 안 된다고 말씀드릴 수는 없지만, 이 표의 경우 그래서는 안 됩니다. 이 표에서 분량을 간추리는 법은 연도를 생략하는 것이지, 국가 자체를 생략할 수는 없어요. 이거는 표마다 다 다르기 때문에, 많이 써보시면서 감을 익히는 수밖에 없습니다ㅠㅠ
총평: (5/6/7/6) 6.0
사실 수치만 잘 적어주셨어도 6.5 정도는 괜찮았을 글이라 조금 아쉽긴 하네요.
표는 차 1000대 당 훔쳐진 차량의 대수를 의미합니다. 예를 들어, 94년 스웨덴에서는 차 1000대 당 10대가 훔쳐진 것이죠. 이거랑 10000대는 완전히 다르므로 주의해주셔야 합니다.
수고하셨습니다 :)

 비밀번호 확인
 댓글 0개
댓글 0개


 불편사항 신고