


 인쇄
인쇄


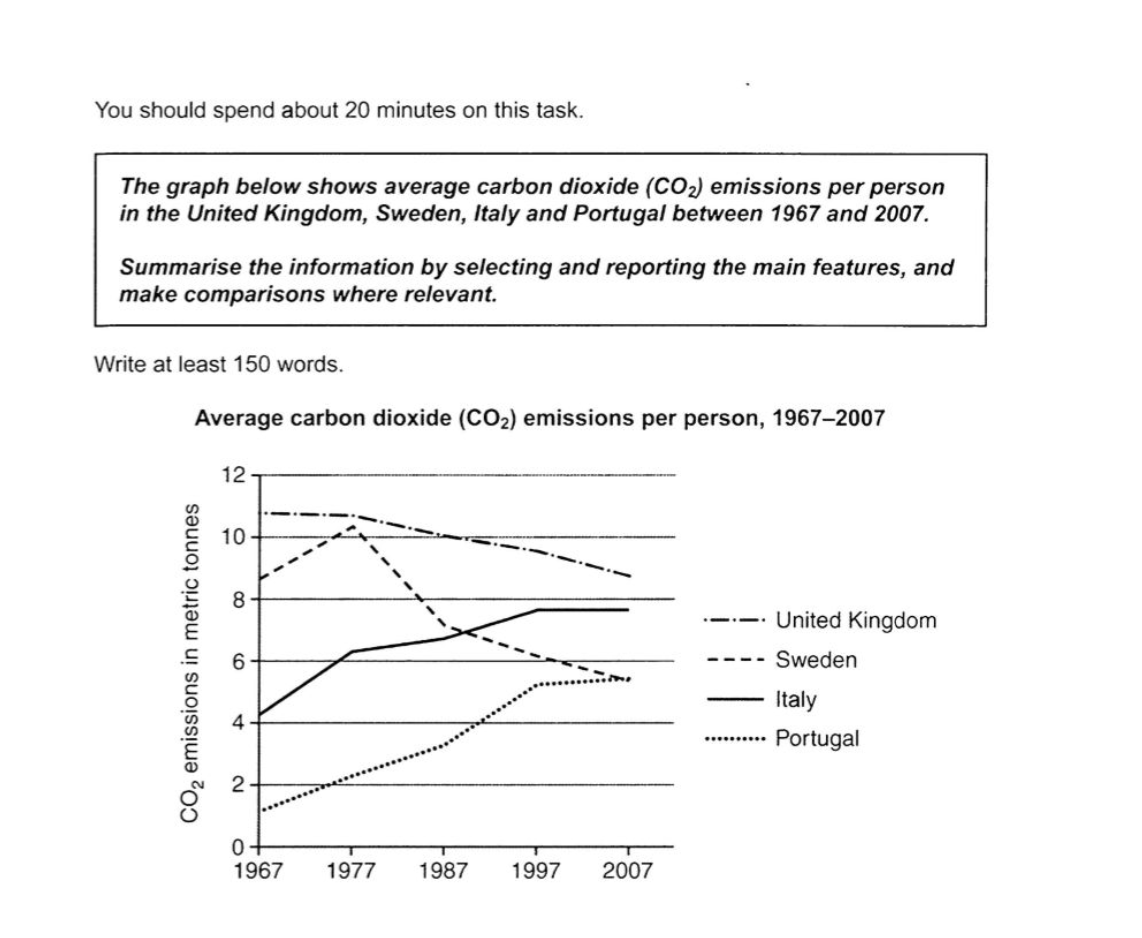
This line graph illustrates how much use carbon dioxide in 4 countries where are UK, Sweden, Italy and Portugal for 50 years. From 1967 to 2007, there are classified with the amount of tones of CO2 emissions.
Overall, it is clear that the largest use of CO2 in several countries is the United Kingdom at 11 tonnes in 1967. Nevertheless of going down slightly, this graph remained to first place until 2007. Therefore, the figure that Portugal emitted carbon dioxide is gradually getting higher, but still at the bottom.
In further detail, there was a turning point with three countries in 1977. According to this trend, in Sweden, they peaked over 11 metric tonnes of CO2. Since then, on the other hand, the graph line decreased to 5 without any growth. With regard to other figures, both of them which are Sweden and Italy reversed each other in 1987.
As the result, the amount of carbon dioxide in all countries was up to 5 tonnes with no under 4 which was the first point of Italy.
목표점수 6.5
시간 22분
총 176단어

 댓글 0개
댓글 0개


 불편사항 신고