


 인쇄
인쇄


걸린시간 : 14분
The chart below shows the changes
that took place in three different areas of crime in Panama City from 2010 to
2019.
Summarise the information by selecting and reporting the main
features, and make comparisons where relevant.
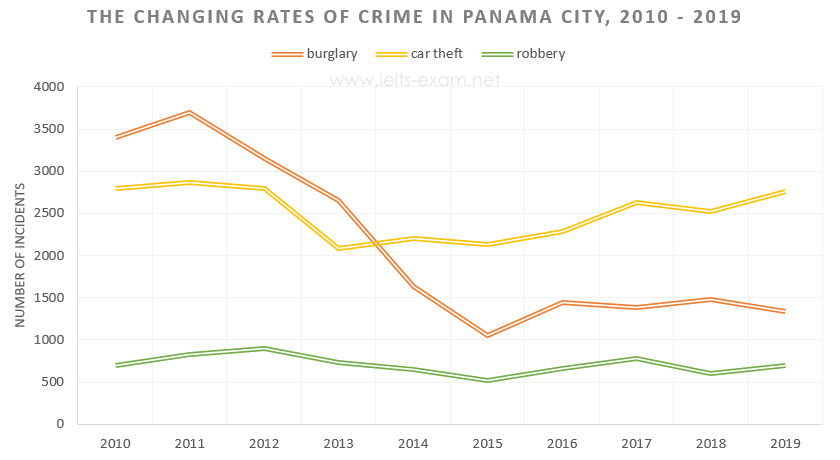
The chart indicates the information on the changing crime
rates in Panama City divided into three parts: burglary, car theft, and
robbery, over the ten years. The calibration of data is done in a number.
Overall, it is evident that one segment incredibly
fluctuated, particularly between 2011 and 2015. In contrast, other segments
were relatively stable.
In more detail, the crime rates of burglary peaked at
approximately 3500, which is the highest rate among those of any segments. However, it
seemed to show a downward trend since 2011. Moreover, it went exponentially
down between 2013 and 2015. After all, its number of incidents hit about 1000
in 2015, which is three times lower than its highest rate. At the same time,
although the rates of car theft also decreased by 1000, it was enough to overtake
the first place. Robbery has had some shifts over the ten years, but it always
hit a low.

 댓글 0개
댓글 0개


 불편사항 신고