


 인쇄
인쇄


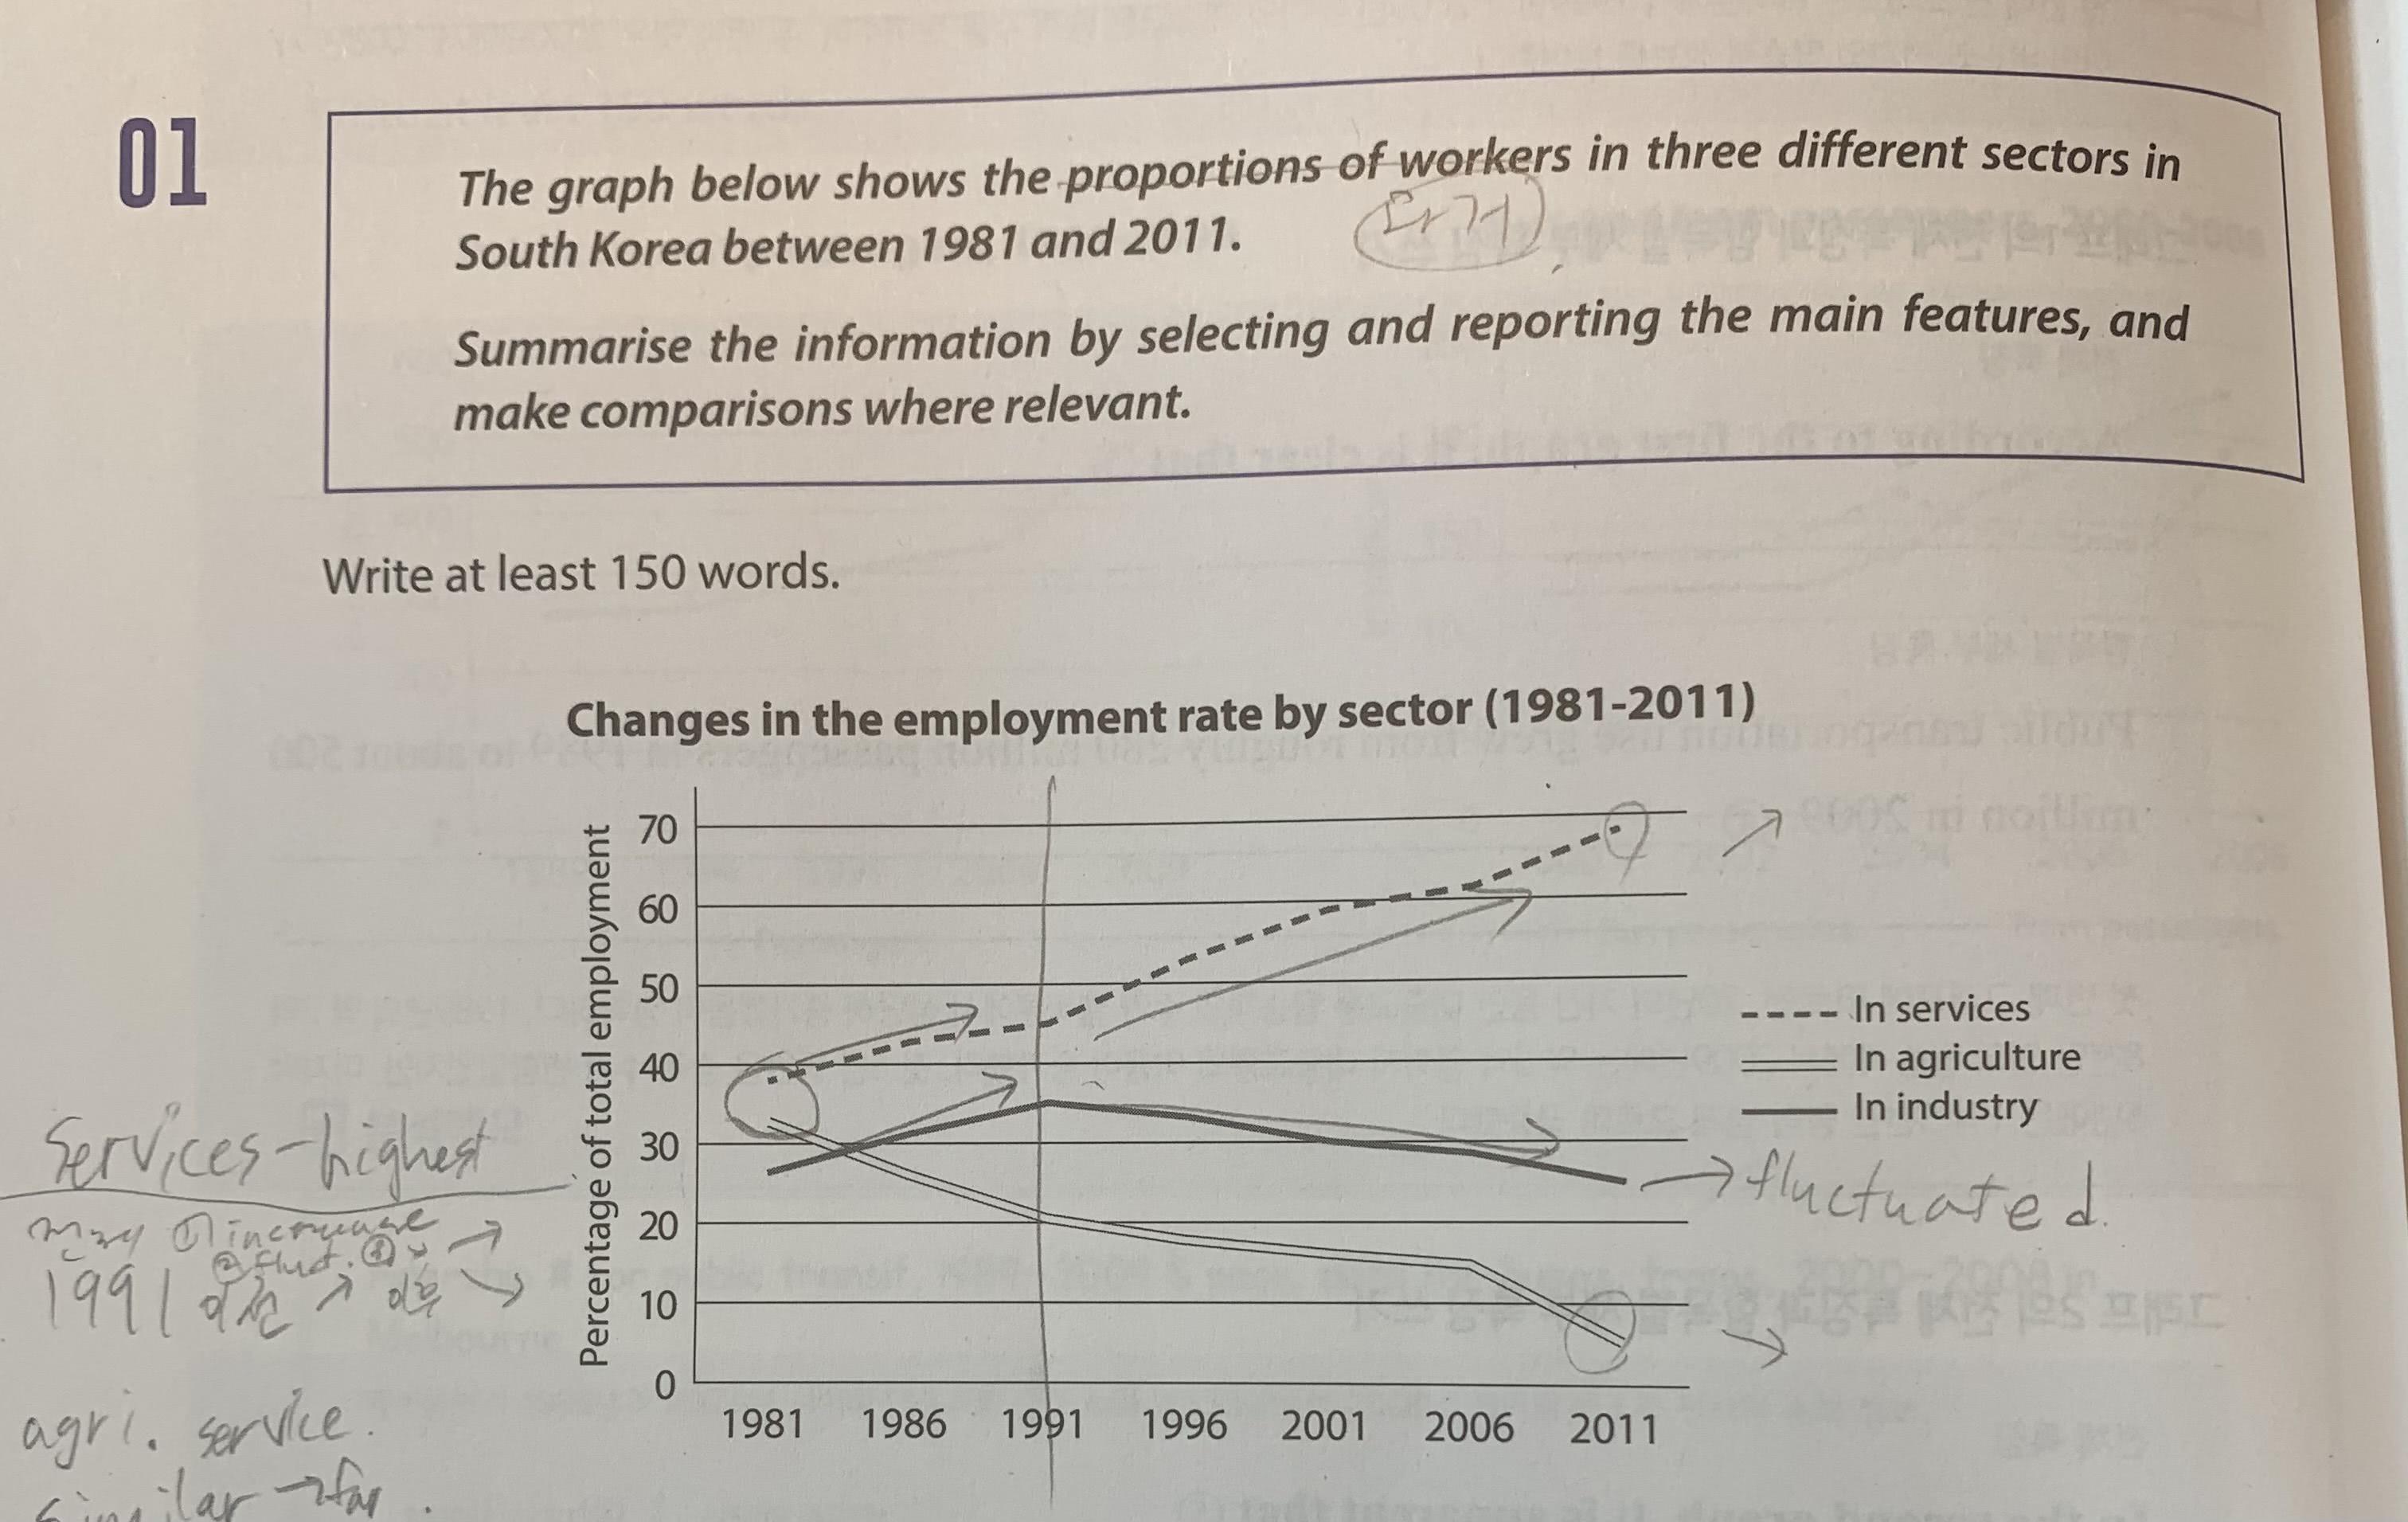
The line graph illustrates statistical
information about percentage of workers in three different parts in South Korea
from 1981 to 2011. In general, the workers in services had the highest
proportion over the period.
In addition, the employment rate in service
sector have continuously increased between 1981 and 2011, while the rate of
people who worked in agriculture has decreased steadily and the figure of
workers in industry has fluctuated. Looking at the numbers closely, the employment
rates in services and industry had increased until 1991. However, while the
services’ employment rate kept increasing throughout the period, the workers in
industry decreased.
Furthermore, the figures of employment in
agriculture and industry were similar in 1981, 32% and 28%, respectively. As
the time went by, two figures slowly became far away from each other. In 2011,
the figures became 5% and 25%, which were different by 5times. Moreover, the
proportion of people who worked in services had the biggest gap between the
year 1981 and 2011, which were 39% and 69%. In contrast, the rate of people who
worked in industry had the smallest gap, which were 28% and 25%.
21분
단어 수: 189개
목표 점수: overall 7.0 each 6.5

 댓글 0개
댓글 0개


 불편사항 신고