Your Answer ▼
The bar graph shows the changes in the proportion of households owing and renting accommodation in two Britain states for 9 different years from 1918 to 2011. Overall, it is clear that the share of households in rented accommodation had decreased consistently by 2001, while the percentage of households renting accommodation showed gradual growth between 1918 and 2001. Since 1971, when the proportions for two categories were same, the order between them started to be reversed. After that year, owning accommodation became more preferred way of living than renting. Looking at the graph more closely, one can see that the share for households owning accommodation doubled in percentage point for first 53 years, from 23% in 1918 to 50% in 1971. It kept its growth after that year surpassing the proportion of households renting accommodation, and peaked at around 79% in 2001. In contrast, the households in rented accommodation whose percentage was 87% in 1918, declined consistently, and hit a low of 32% in 2001. Meanwhile, its upward trend was seen during the last ten years, reaching at 36% in 2011. For the same periods the portion of households owning accommodation dipped a little, scoring 63% in 2011. |


 인쇄
인쇄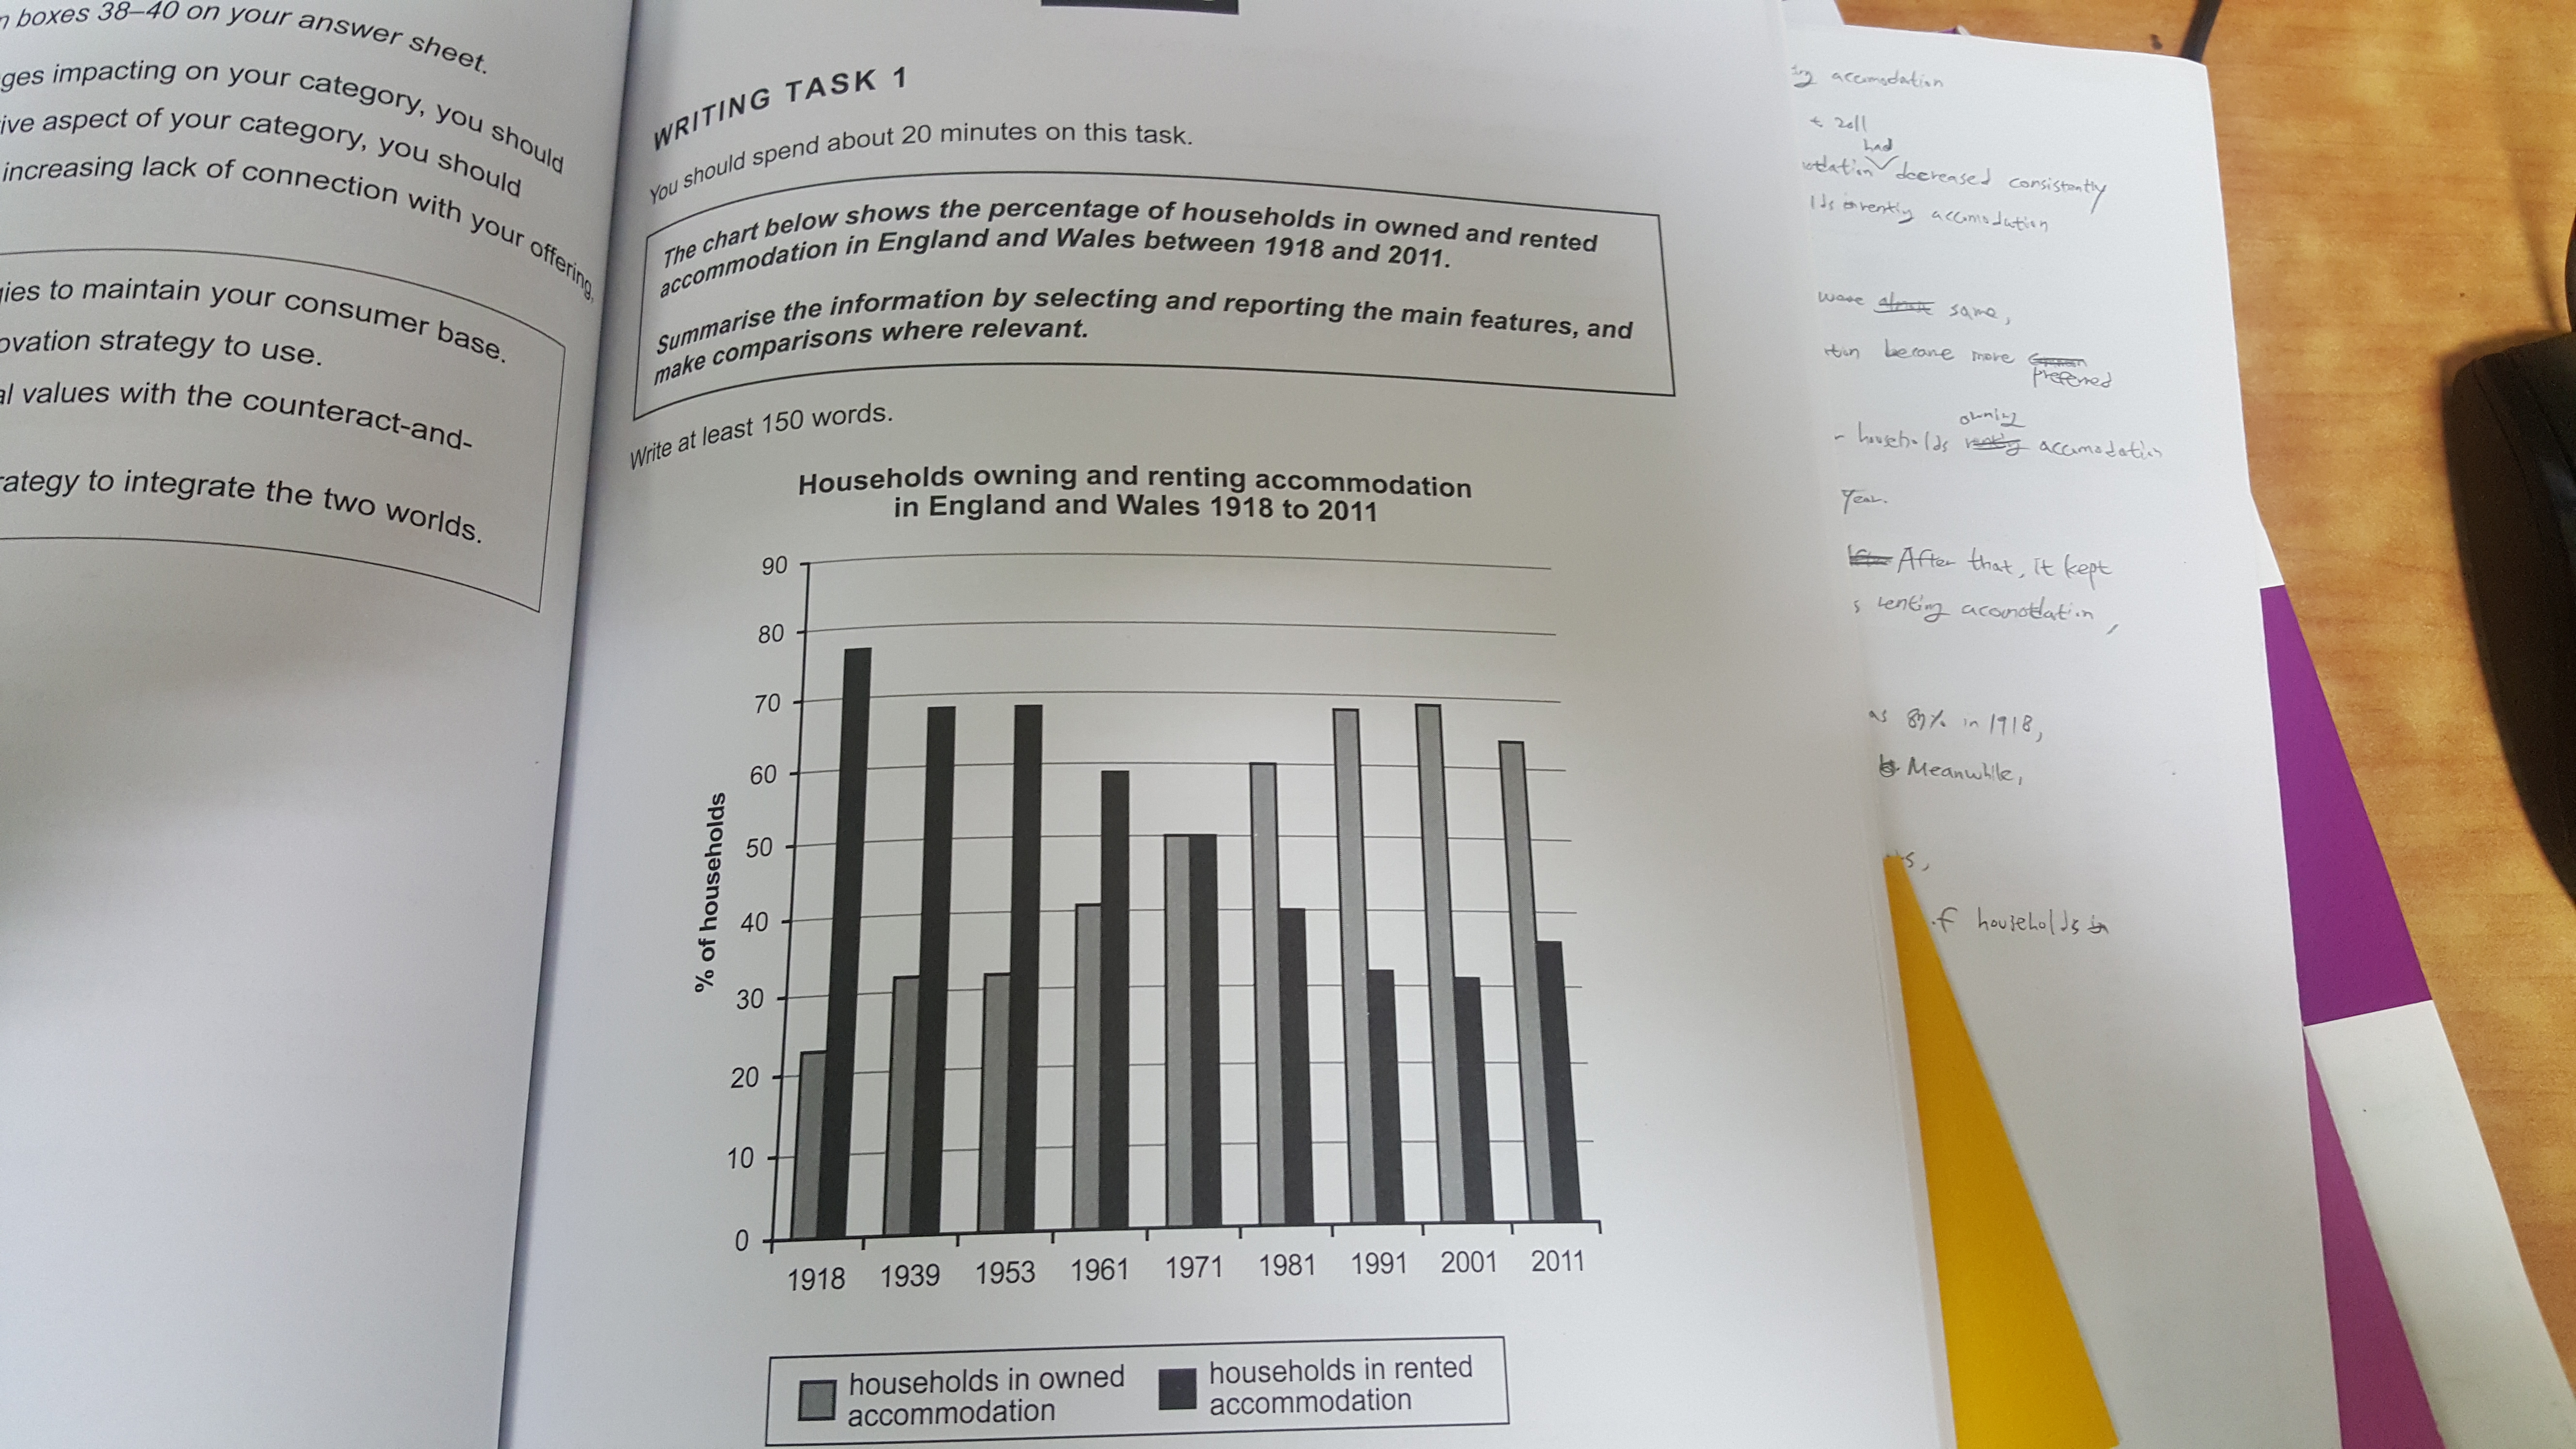


 댓글 0개
댓글 0개


 불편사항 신고