


 인쇄
인쇄


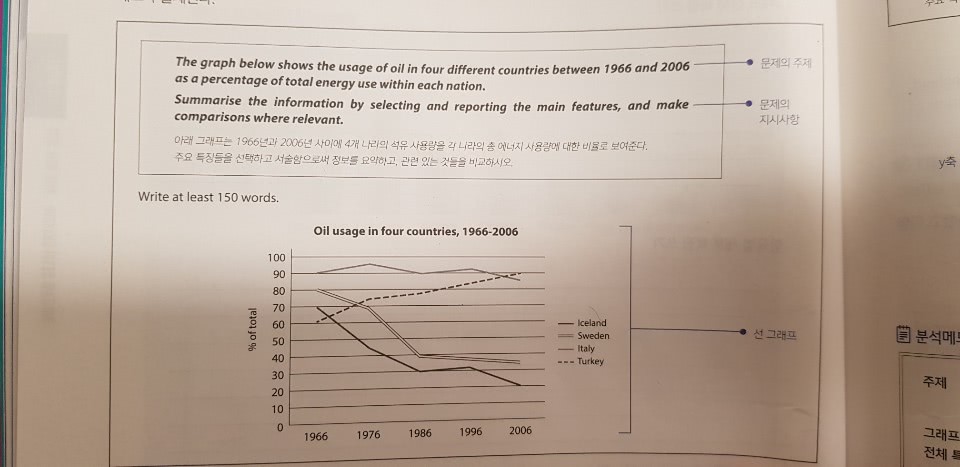

The line graph shows the usage of oil in Iceland, Sweden, Italy, and Turkey over a four-decade period as a proportion of the total energy use.
Overall, it is clear that the proportions of oil uses in Iceland and Sweden show significant declines during the period. On the other hand, the other two countries' figures relatively stable between 1966 and 2006. The gap between the two groups had widened toward the end of the period in question.
Looking at the data more closely, one can see that the share of oil uses in Iceland and Sweden had decreased considerably under one-second of the initial figures over the 40 years. Meanwhile, Italian figure was the highest percentage in 1966, and by 2006, had been relatively consistent, which remained at roughly 90 percent. However, the rate of Turkish oil use had risen from about 60 percent in 1966 to about 90 percent in 2006 and became the highest proportion oil usage, which was followed by Italian percentage in 2006.

 댓글 0개
댓글 0개


 불편사항 신고