


 인쇄
인쇄


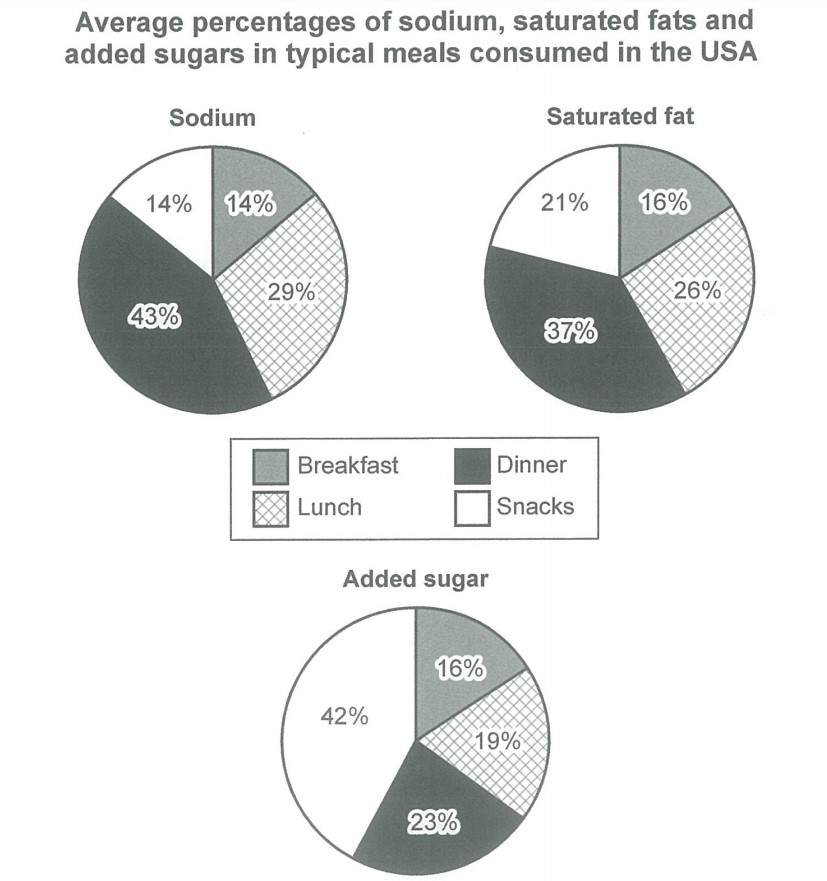
The given pie charts illustrate information on the proportion of typical meals of different types of nutrients, all of which may be unhealthy if eaten too much in the USA.
Overall, it is clear that the total percentage of sodium and saturated fat showed similar pattern unlikely that of added sugar.
In detail, the USA people usually sodium and saturated fat of tree types nutrients intake at dinner as was 43% and 37 percent. The rate of sodium at dinner was the highest figure. At lunch, also the percentage of sodium, at 29%, was larger than saturated fat which accounted for 26% of all. Interestingly, among the sodium figure, the ratio of breakfast and snacks was seen equal percentage. Meanwhile, there were by 5% points gap between other sectors in saturated fat.
Moving to added sugar, 42% of all was snacks which was larger figure of it. The percentage of dinner was a half of the same sectors of sodium at 23%. Likewise, the rate of lunch depicted by 10% points with that of sodium. Both added sugar and saturated fat was shown same rate as it made up 16%.
총 글자수:190자
총 소요시간:23분

 댓글 0개
댓글 0개


 불편사항 신고