


 인쇄
인쇄


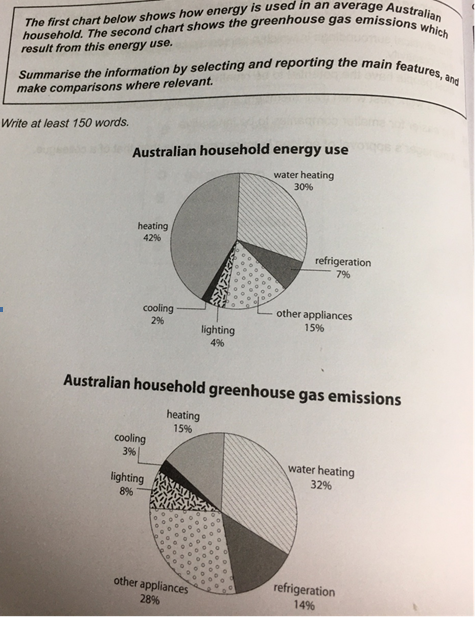
The provided two charts give us information
about the proportion of the six different sectors between energy use and gas
emissions of Australian household.
What is the most remarkable point is that
the ratio of heating segment dramatically decreases compared to two charts
specified whilst the percentage of the remaining sectors somewhat increases
depends on the specific items.
The lighting and refrigeration items just
were spent on energy use 4% and 7% respectively, but both of them end up with
exactly double points in gas emissions. Furthermore, the portion of other
appliances sector in gas consumption also accounts for 28% that is are almost
two times compared to the point of energy use.
Another key factor is that cooling and
water heating’s
rate marginally increased by only 1% and 2% points from the table of energy use
to gas emissions. Interestingly, there is substantial dropping off figures in
heating portion in gas emissions.
실력은 점점 줄어드는 느낌이네요.....
시간은 30분 걸렸습니다. 시험은 2월 말인데 걱정이네요.
목표는 7점 입니다.. 7.5는 아무래도 비현실적인 것 같네요.

 댓글 0개
댓글 0개


 불편사항 신고