


 인쇄
인쇄


이게 제목이고 저는 이렇게 적었습니다.
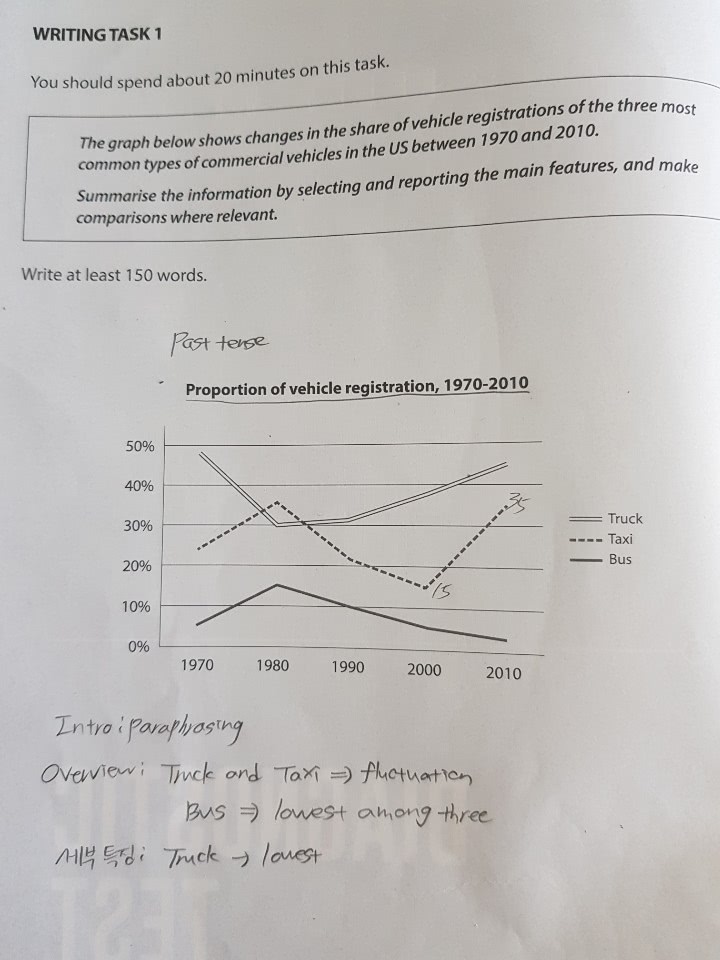
The graph indicates how the percentage of registering vehicles changed from 1970 to 2010.
Overall, it is apparent that the share of truck and taxi fluctuated over the 4 decades. In particular, that of truck was the highest except 1980. In contrast, bus had the lowest as a proportion of vehicle registration throughout all the time in question.
Looking at the graph more closely, one can see that although the percentage of registering truck sharply declined over the first decade, reaching at just 30%, it steadily rose 15% points between 1980 and 2010. In addition, the share of taxi increased at the beginning, but it nearly halved to approximate 15% over the 20 years. Then, it soared 20% points in the last decade of whole periods. Lastly, even though a similar pattern was seen in the proportion of bus between 1970 and 2000, unlike taxi, bus share hit a low of below 5% in 2010. (155 words, 18 minutes)
항상 감사합니다. 비밀번호는 1234입니다.

 댓글 0개
댓글 0개


 불편사항 신고