


 인쇄
인쇄


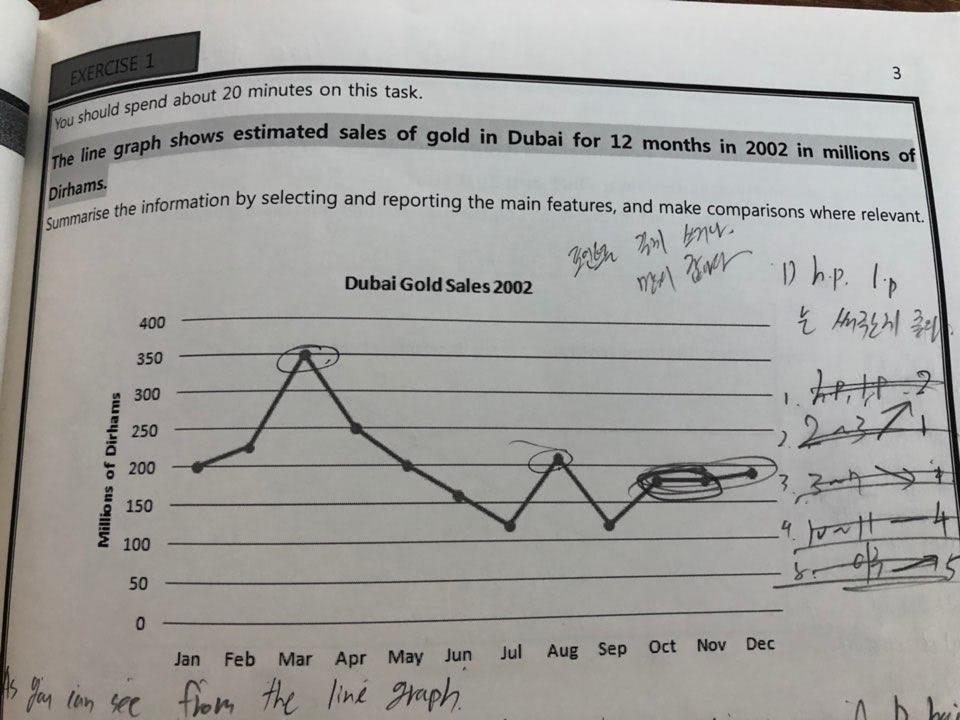
The above line graph demonstrates Dubai’s sales amount of gold for 1 year in 2002 in millions of dirhams.
Overall, It is clear that between January and March, the sales amount of gold was increased steeply. However, after March, the line graph had a decline trend except August.
Looking at the line graph more closely, as I mentioned above, There was increasing part from January to March by 150 millions of dirham. In addition, Dubai was hit a record to 350 millions of dirham in March. Whereas, unfortunately after March, The gold sales was steady decreased until July with around 125 millions of dirham. In spite of long decrease time, In August, they reached to 200 millions of dirham, but this rising trend could not relate to next month. After September, there was nothing to special change between October and December at around 175 millions of dirham.
To sum up, Dubai gold sales was popular between January and May, and August. In those months, the sales amount of gold in Dubai were reached at least over the 200 millions of dirhams.
7.0 목표로 하고 있습니다. ( 181 words )
+ TASK 2에서의 첨삭 잘 받았습니다! 피드백대로 열심히 하고 이행하고 있구요, TASK 1도 냉철하게 평소처럼 잘 부탁드립니다.

 댓글 0개
댓글 0개


 불편사항 신고