


 인쇄
인쇄


1. overall 6.5 목표로 합니다. 리스닝이 가장 약한것 같습니다.
2. 점수는 올해 6월 전에 만들면 되는데, 테스트 삼아서 3월 14일 혹은 21일 시험을 봐볼까 합니다.
3. TASK 1은 처음 작성해 봅니다. 도움은 받지 않았고 20분 꽉 채워서 작성했습니다. 인강 들을때는 쉽고 깔끔하게 분석해서 작성 할 수 있을 것 같았는데 막상 해보니 뭘 써야 하는지도 잘 모르겠고, 같은 말이 반복되는 문제가 있네요. 허술한 분석이 된 것 같습니다.
항상 첨삭해 주셔서 감사드립니다. 직장인이라 학원 다니기도 공부 하기에도 시간이 애매한데 라이팅 첨삭 받아볼 수 있는 기회가 이렇게 있어서 얼마나 좋은지요. 코로나 조심하세요 ^^
A
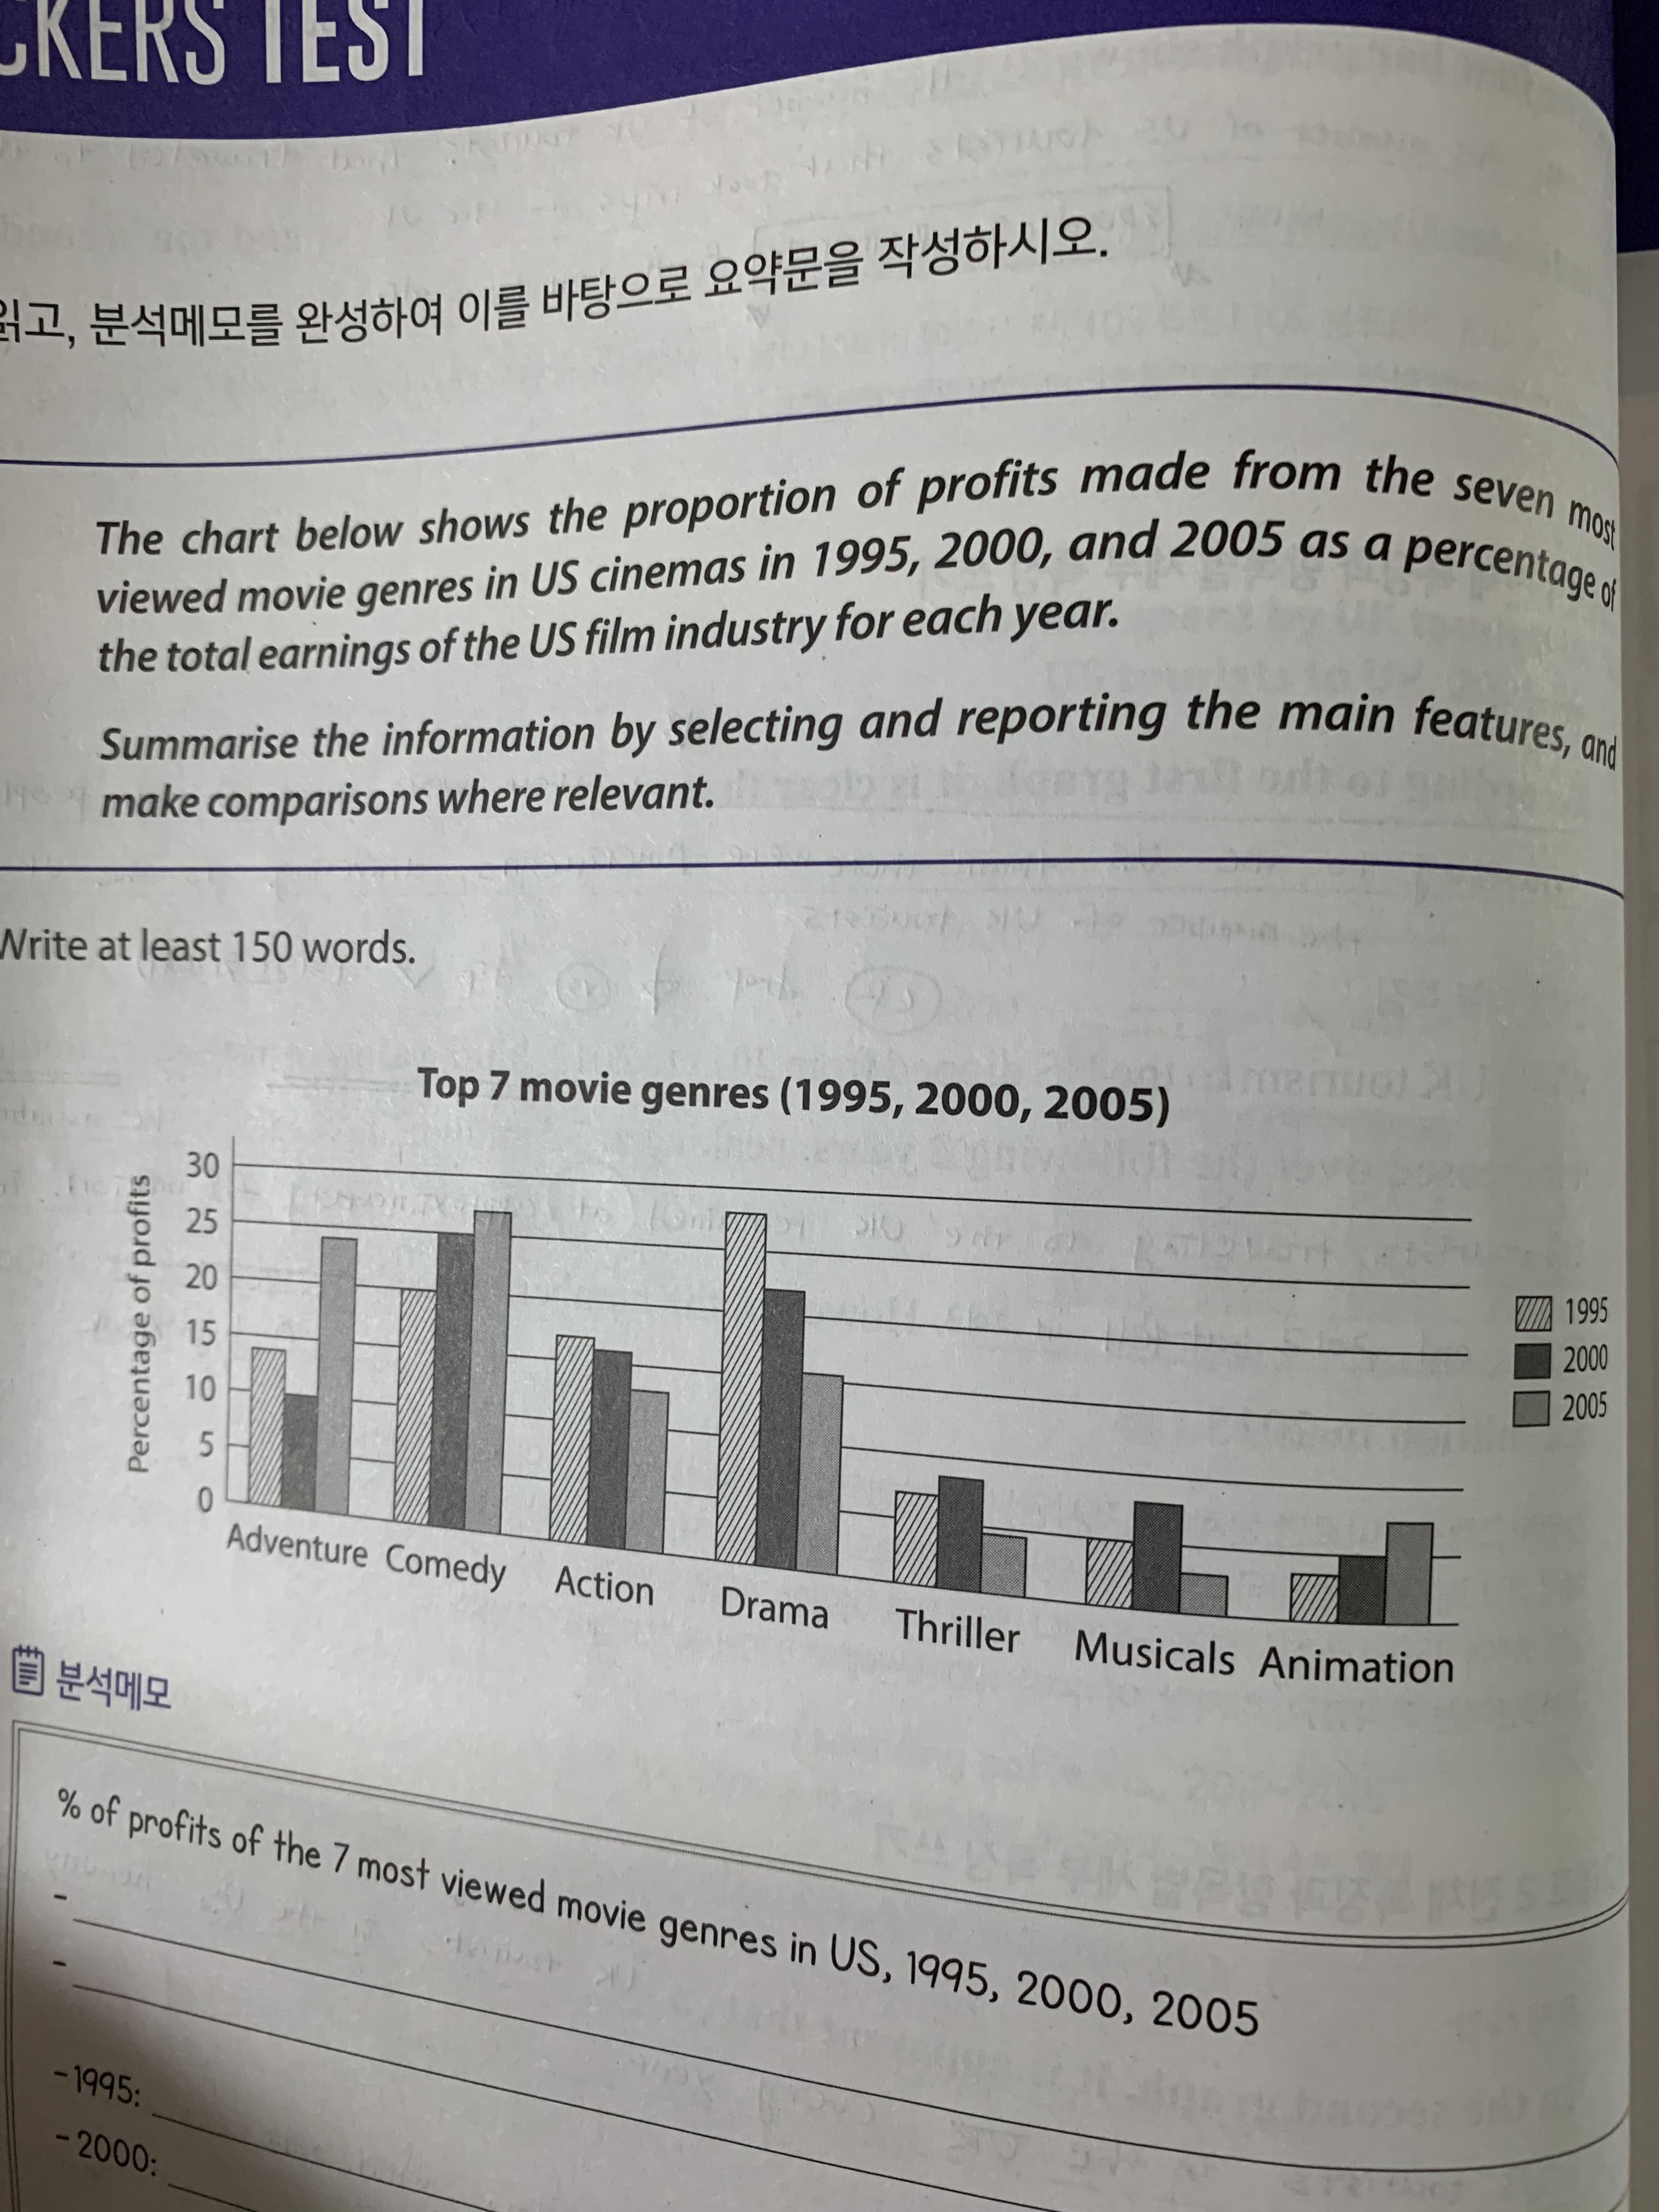
The bar graph illustrates the percentage of profits made from the top seven movie genres in US cinemas in 1995, 2000 and 2005.
According to the graph, movies belong ing to Adventure, Comedy, Acntion and Drama genres made higher profits than movies in Thiriller, Musicals and Animation gneres did for each year in the question.
Looking at the chart more closely, the percentage of profits made from Comedy and Animation genres increased continually. The profits percentage of Comedy raised from 20% to approximately 27% during this period and that of Animation raised from 3% to 8%. Meanwhile, the percentage of profits for Action and Drama declined steadily, each from 17% to 13% and from 27% to 15%. The rest three genres' percentage of profits fluctuated in those three years in the question. While the percentage for Thriller and Musicals went up between 1995 to 2000 and went down from 2000 to 2005, that for Adventure dipped in 2000 and went up again in 2005.

 댓글 0개
댓글 0개


 불편사항 신고