


 인쇄
인쇄


|
You should spend about 20 minutes on this
task. The pie graphs below show the result of
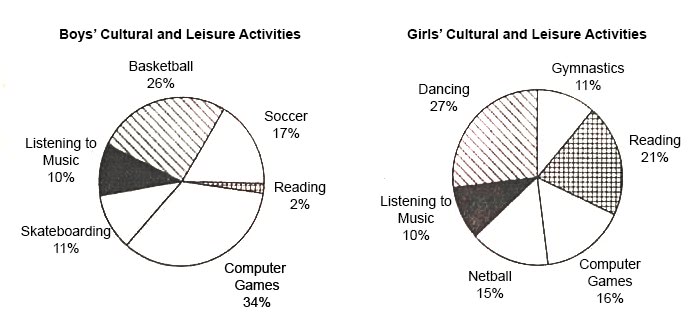
a survey of children's activities. The first graph shows the cultural and
leisure activities that boys participate in, whereas the second graph shows the
activities in which the girls participate. Write a report describing the information
shown in the two pie graphs. Write at least 150 words.
|
|||
|
The given pie charts illustrate the teenagers’ usual cultural and physical hobbies. One chart depicts the activities of boys and the other one is the girls’ chart. On the whole, both charts show half of the proportion consist of the sedentary lifestyles and the other half is taken by the leisure activities. Notably, the biggest graph in both groups is Computer games in male students’ survey. Almost three out of ten boys enjoy computer games as their main activities and it is followed by that of Basketball(26%). It is interesting to note that the lowest figure in the whole group can be found in the male chart that is Reading. Only 2% of boys spend their extra time with books. On the contrary, one out of five female students read books to spend their free time and this is the second popular choice in the graph, in addition, the proportion is about almost tenfold bigger than that of boys. The largest figure in the girls’ survey is dancing; slightly higher than the second popular activity of boys. Lastly, listening to music is the least favorite choice in the girl’s chart, the same as much percentage as the rate of boys who choose the same leisure. |
|||
|
[ 205 words] |
|||
|
Grammar |
Vocabulary |
Cohesion
and Coherence |
Task
Response |
|
/9.0 |
/9.0 |
/9.0 |
/9.0 |
감사합니다.

 댓글 0개
댓글 0개


 불편사항 신고