Your Answer ▼
The line graph demonstrates information on
energy usage by source in USA over the period from 1980 and anticipation till
2003.
First of all, as you clearly seen, petrol and
oil have taken the highest consumption of the sources throughout the period
from 1980 and current years ,and it is anticipated that it will stay the
highest one by reaching almost 50 quadrillion.
Secondly, even though there was little fluctuant
time for both coal and natural gas usage between 1980 and 2010, natural gas is
predicted to remain stable as the second highest consumption at the level of
25-quadrillion after 2015 ,and the usage of coal will be expected to increase
steadily up to 30-quadrillion..
Lastly, the projection of alternative energies
consumption such as hydropower, nuclear, solar and wind are quite the same from
1980 and 2030.
To
be more specific, Nuclear, solar and wind energies will slightly grow by
reaching almost 6-quandrllion,
Moreover, hydropower will stay at the level of
5-quadrillion until in the year 2030..
| 


 인쇄
인쇄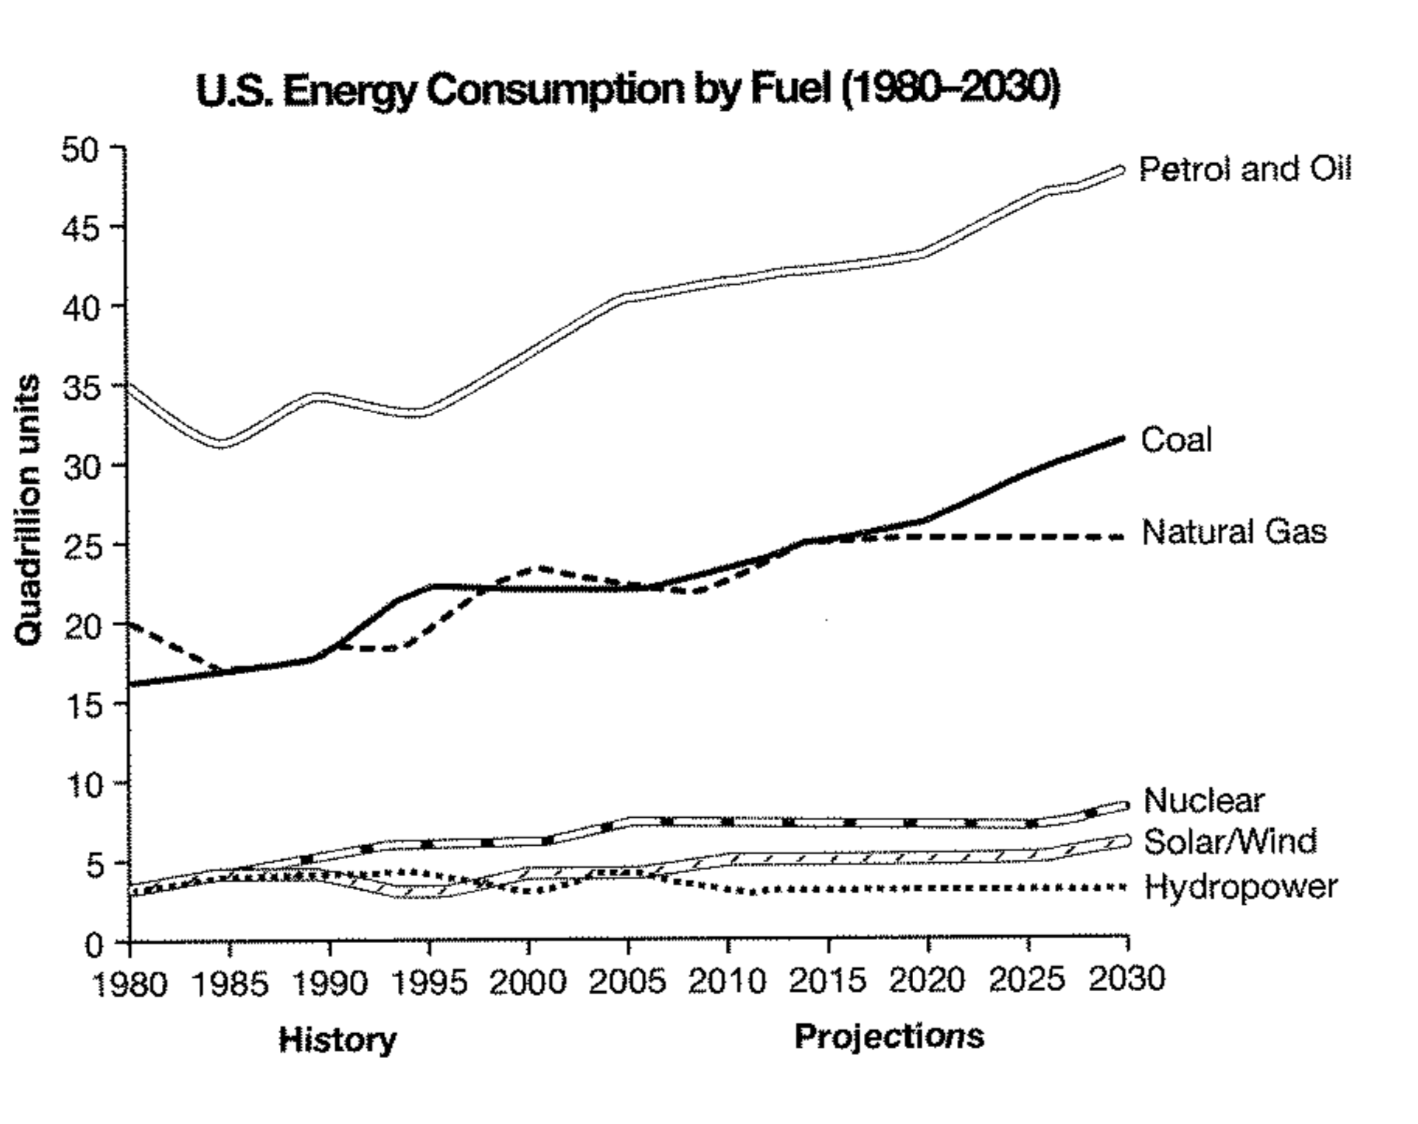


 댓글 0개
댓글 0개


 불편사항 신고