


 인쇄
인쇄


IELTS 아카데믹 Writing Task1문제 및 답안 예제입니다.
답안은 두개인데 5점과 7점 맞은 답안 입니다. 어떻게 다른지 비교분석해 보세요~
Writing Task 1
You should spend about 20 minutes on this task.
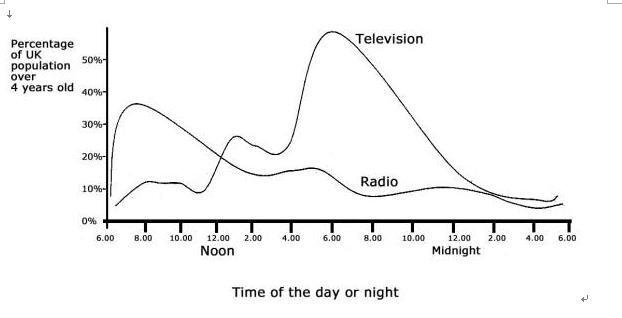
The graph below shows radio and television audiences throughout the day in 1992.
Write a report for a university lecturer describing the in formation shown below.
You should write at least 150 words.
Radio and television audiences in the UK, October-December 1992.
Original version (Band 5)
The graph shows the percentage of audiences over 4 yes old of UK follows the radio and television thoughout the day during the period October-December 1992.
It has been observed from the graph that less than 10% audiences follows the radio at 6:00 am and the percentage raised to a pick around 30% at 8′AM and decline gradually to around 10% during the period 2′00 to 4′00 Pm and again raised a bi t to around 12% between 4′00 to 6′00 PM. It hen again dropped to below 10% at around 10′PM.
The rate again raised to a bit between 10′00 PM to 12′00 PM and then dropped slowly by 4′00 AM.
On the other hand, the rate of television audiences raises 0-10% during the period 6′00 to 8′00 am and remain steady up to 1 0′AM and then gradually goes down by 12′00 noon.
The percentage raised dramatically to around 15% by 2′00 noon.
The percentage raised dramatically goes down by 12′00 noon.
The percentage raised dramatically to around 15% by 2′00 PM which again raised to a pick above 40% between 6′00-8′00 PM and then gradually dropped between the period 12′00 PM to 4′00 AM.
Original Version(Band 7)
The bold graph shows the television audiences throughout the day.
It shows that the percentage of audiences is zero percent in early morning but it gradually rises unto ten percent at 8:00 am and maintains the same for the next two hours.
There is a slight fall in percentage in next two hours however after that it rises sharp unto twenty percent within the next two hours.
After this the graph rises very fast and attains it's peak at 10 pm which is about forty five percent.
The the graph gradually falls down and at 2:00 am it is at five percent.
The thinner graph shows the percentage for radio audiences.
Unlike the television one the peak percentage of the radio audiences is at 8:00 am which is about 30 percent. Then it gradually falls and it corresponds with the television one at two pm.
After that it gradually falls but with a small increase in percentage at 4:30 to 6: 00 pm.
The percentage of audience then gradually goes down and at four AM it is the lowest which is near 2 percentage. These graphs prove the progressive popularity of television.

 댓글 1개
댓글 1개


 불편사항 신고