


 인쇄
인쇄


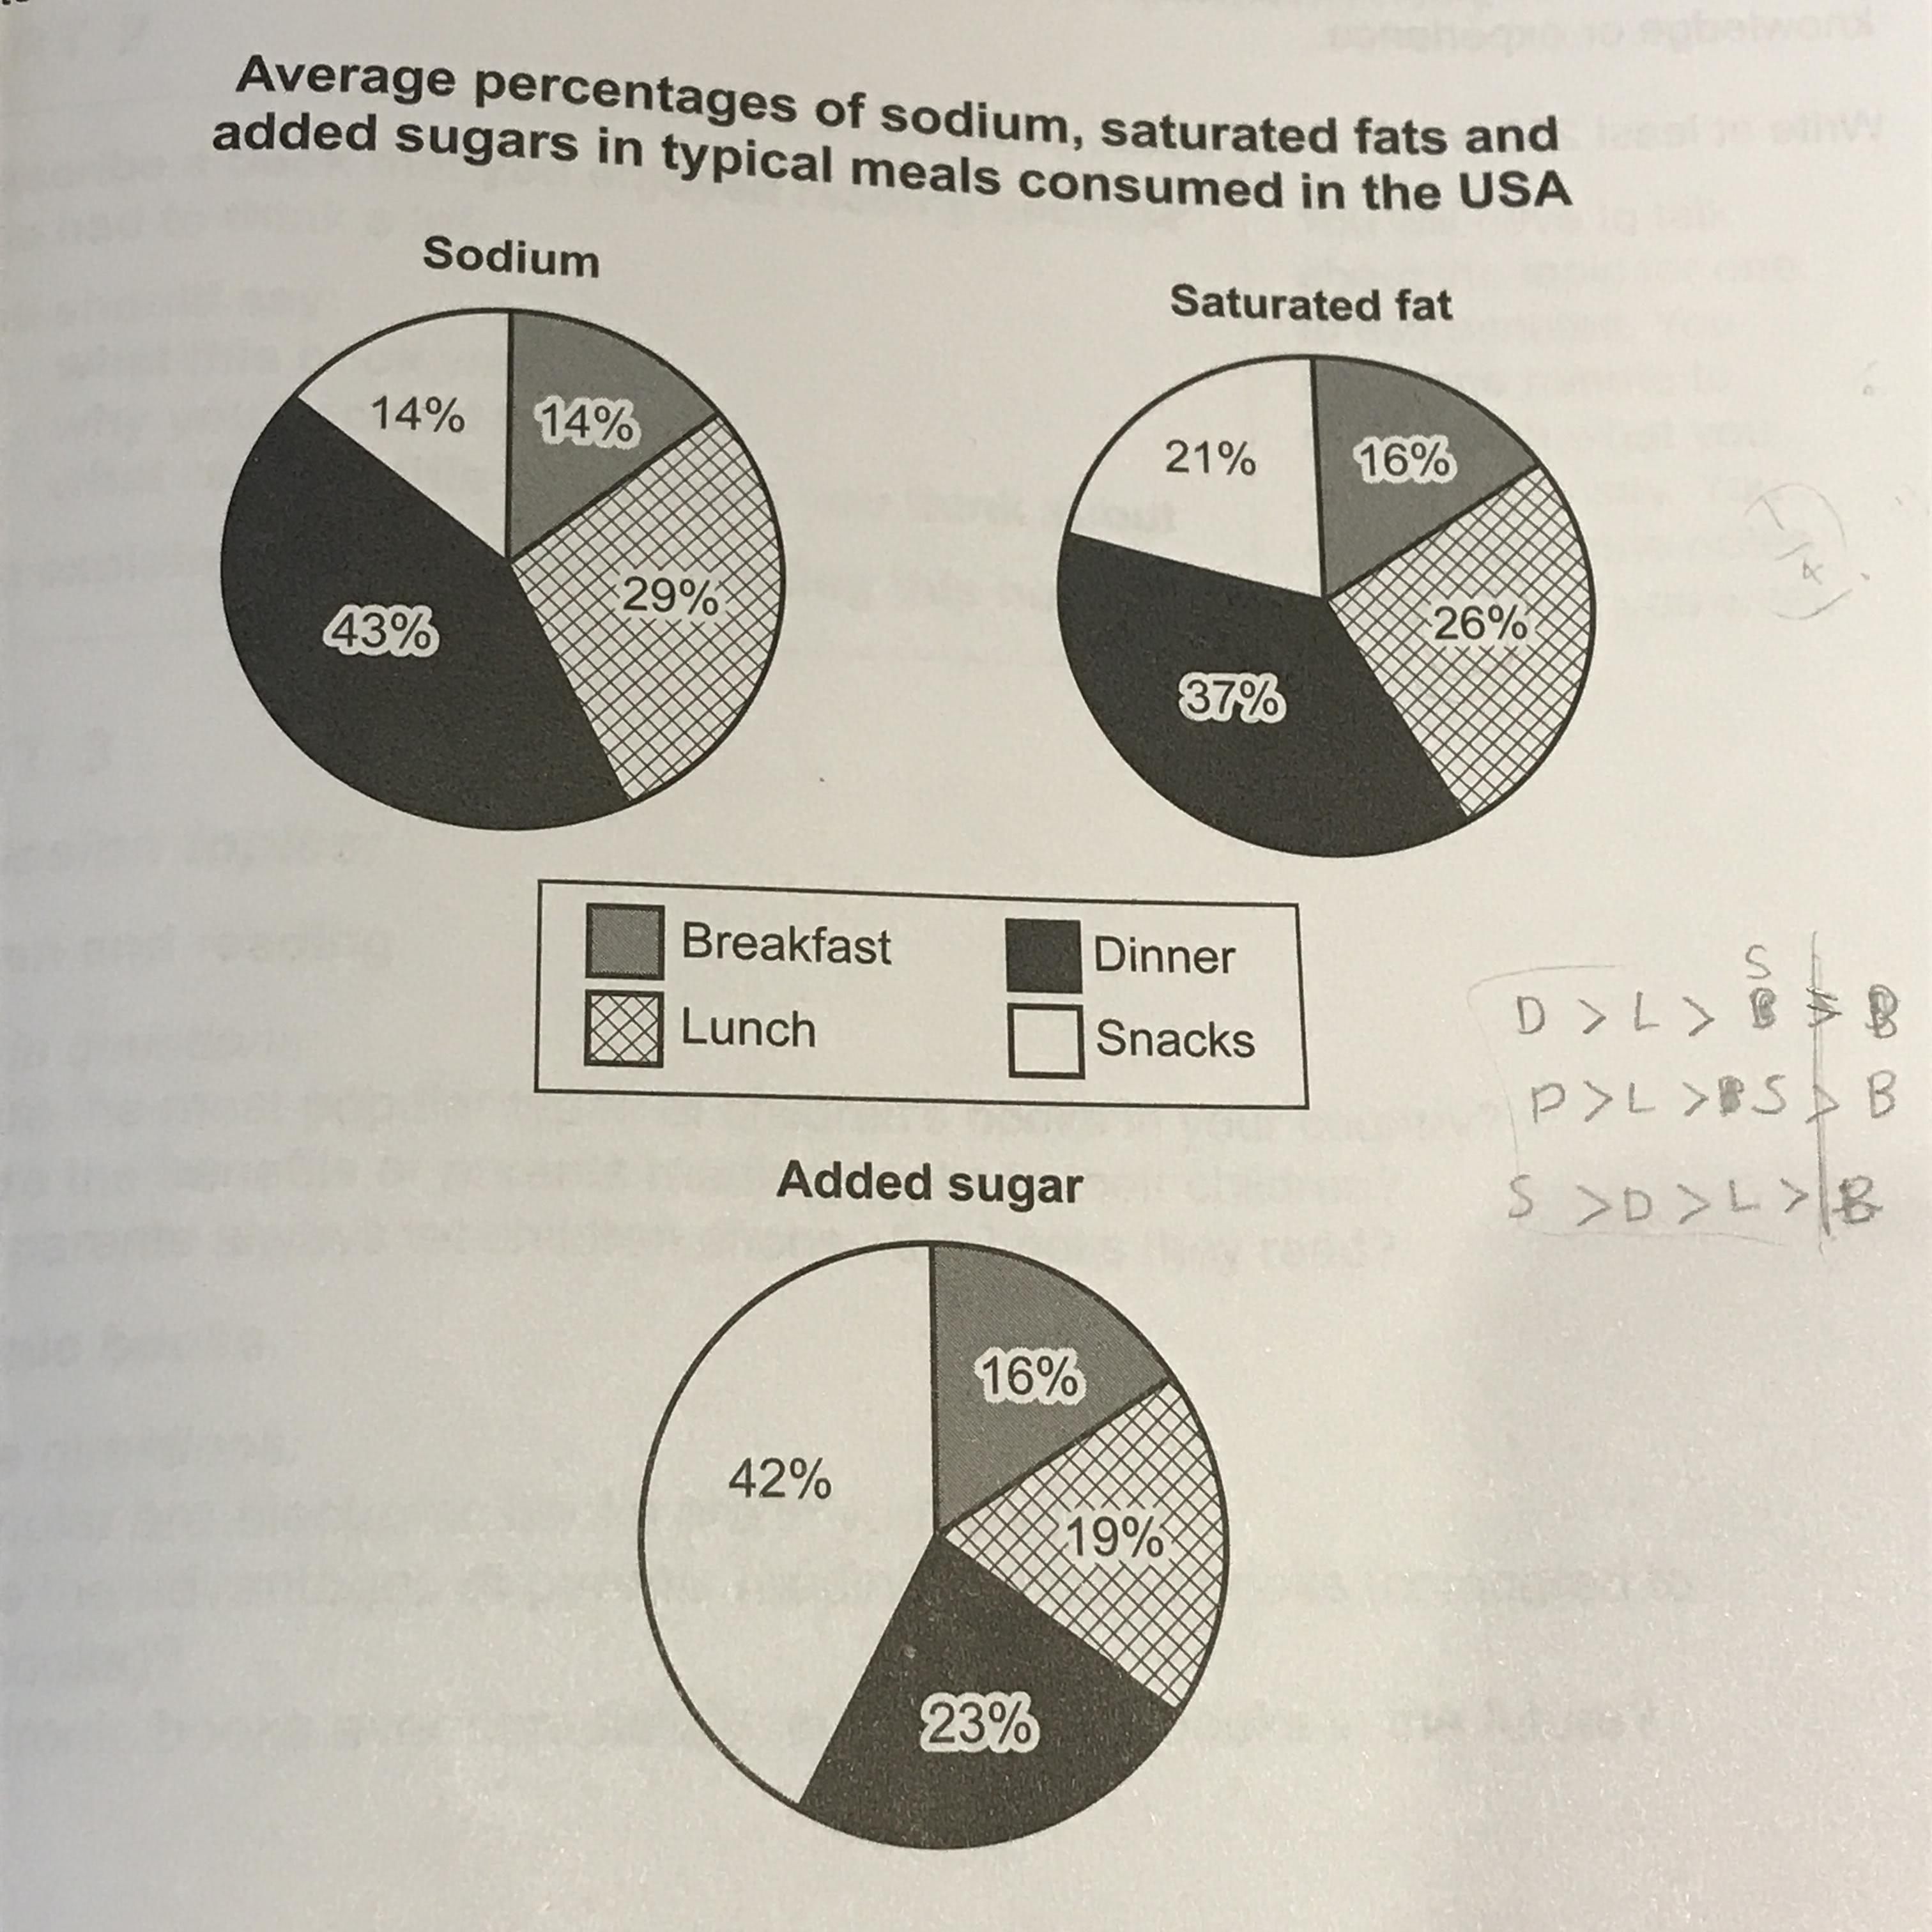
Three pie charts below illustrate the average percentage of three types of nutrients in typical meals consumed which may be harmful if eaten too much. In all charts, breakfast takes up the least percentage with 14%, 16% and 16% each. (Overview를 적을 때 구체적인 수치의 적시는 따로 하지 않습니다. 이는 세부적인 분석을 할 때, 즉 밑에서 해주시면 돼요.)
The most conspicuous point is the chart of Sodium and Saturated fat (여기 포함 싹 소문자 시작해주시면 됩니다.) has similar patterns. Dinner takes up more than a third in bothcharts in both. Especially, in the chart of Sodium, dinner accounts for almost half with 43%. Lunch which is followed by dinner is close a quarter in the chart of Sodium and Saturated fat, respectively 29%, 26%.
On the other hand, the added sugar is slightly different from the previous two charts. In this chart, snacks Snacks account for the highest proportion. Snacks in Sodium and Saturated fat only take up respectively 14%, 21%. And (문장을 and but so로 시작하는 것은 좋지 못합니다.) dinner, which is the biggest part of the chart of Sodium and Saturated fat is third from behind in Added added sugar.
총평: (6/7/7/6) 6.5
대소문자 구분에서 약간의 문제가 있던 점이 조금 아쉬웠네요. 일반적으로 task 1에서 항목의 대소문자가 헷갈리실 때, '시험장에서는' 에라 모르겠다 하고 소문자로 찍으시면 됩니다. 그게 맞을 확률이 훨씬 높아요. 물론 연습 단계에서는 얄짤없이 다 정확하게 학습해주셔야 합니다.
수고하셨습니다 :)

 비밀번호 확인
 댓글 0개
댓글 0개


 불편사항 신고