


 인쇄
인쇄


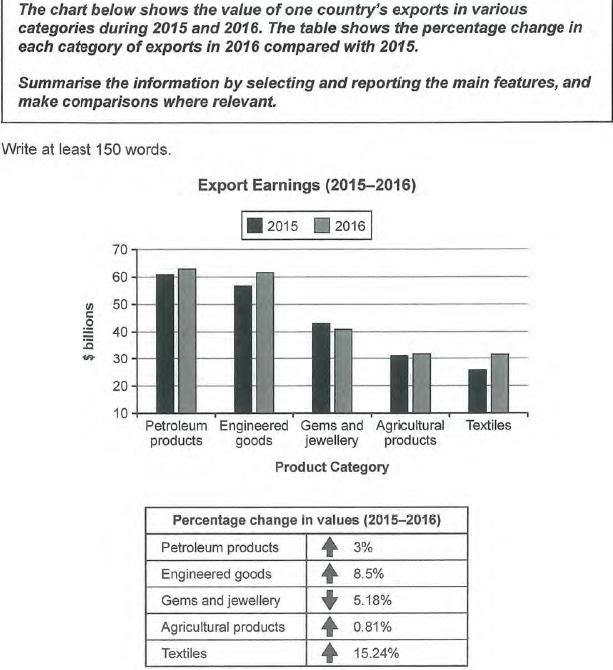
These charts show how much export one country made export in various categories and the percentage changes (기존 표현은 '어떻게 바꿔야 하는지~' 의 의미가 되어버립니다.) how to change the percentage in each categories during 2015 and 2016.
Overall, it is clear that the value of petroleum products was the highest export, while the value of textiles was the lowest exports in a country. All However, all of the value of exports increased for a year except without gems and jewellery.
Looking at the charts more closely, one can see that the value of textiles increased dramatically from 25 billion to 32 billion dollars (다른데에도 다 넣어주시고, 지금처럼 수치가 정확하게 떨어지지 않을 경우 임의로 확정지어 작성해서는 안 되고, '대략' ~~ 과 같이 적어주셔야 합니다.). It showed the biggest was the most growth between 2015 and 2016. The value of engineered goods increased from 55 billion in 2015 to 61 billion in 2016. It rose 8.5 percent (퍼센트포인트는 '비율 수치' 간 산술적인 차이를 구할 때 쓰입니다. 여기와는 아무런 상관이 없고요. 다른데에도 다 바꿔주세요!) percentage point for a year. The value of petroleum products and agricultural products made up 62 billion and 31 billion, respectively. (연도를 넣어주세요~) Those things rose 3 percentage point in petroleum products and 0.81 percentage point in agricultural products during 2015 and 2016. However, only the value of gems and jewellery showed a downward was down trend. It decreased from 43 billion in 2015 to 41 billion in 2016. It dropped 5.18 percentage point between 2015 and 2016.
총평: (5/6/6/5) 5.5
퍼센트포인트는, 위에서 말씀드렸듯이 비율 수치 간 계산을 할 때 쓰입니다. 예를 들면, 20%와 15%는 5 퍼센트포인트 차이가 있는 것이죠. 그러나 여기는 비율 수치가 아니라, 대략 61 million 달러와 63 million 달러, 즉 확정된 절대적인 수치 간 차이를 구하는 상황이라 퍼센트포인트가 쓰일 여지는 없으므로 주의해주세요~수고하셨습니다 :)

 비밀번호 확인
 댓글 0개
댓글 0개


 불편사항 신고