


 인쇄
인쇄


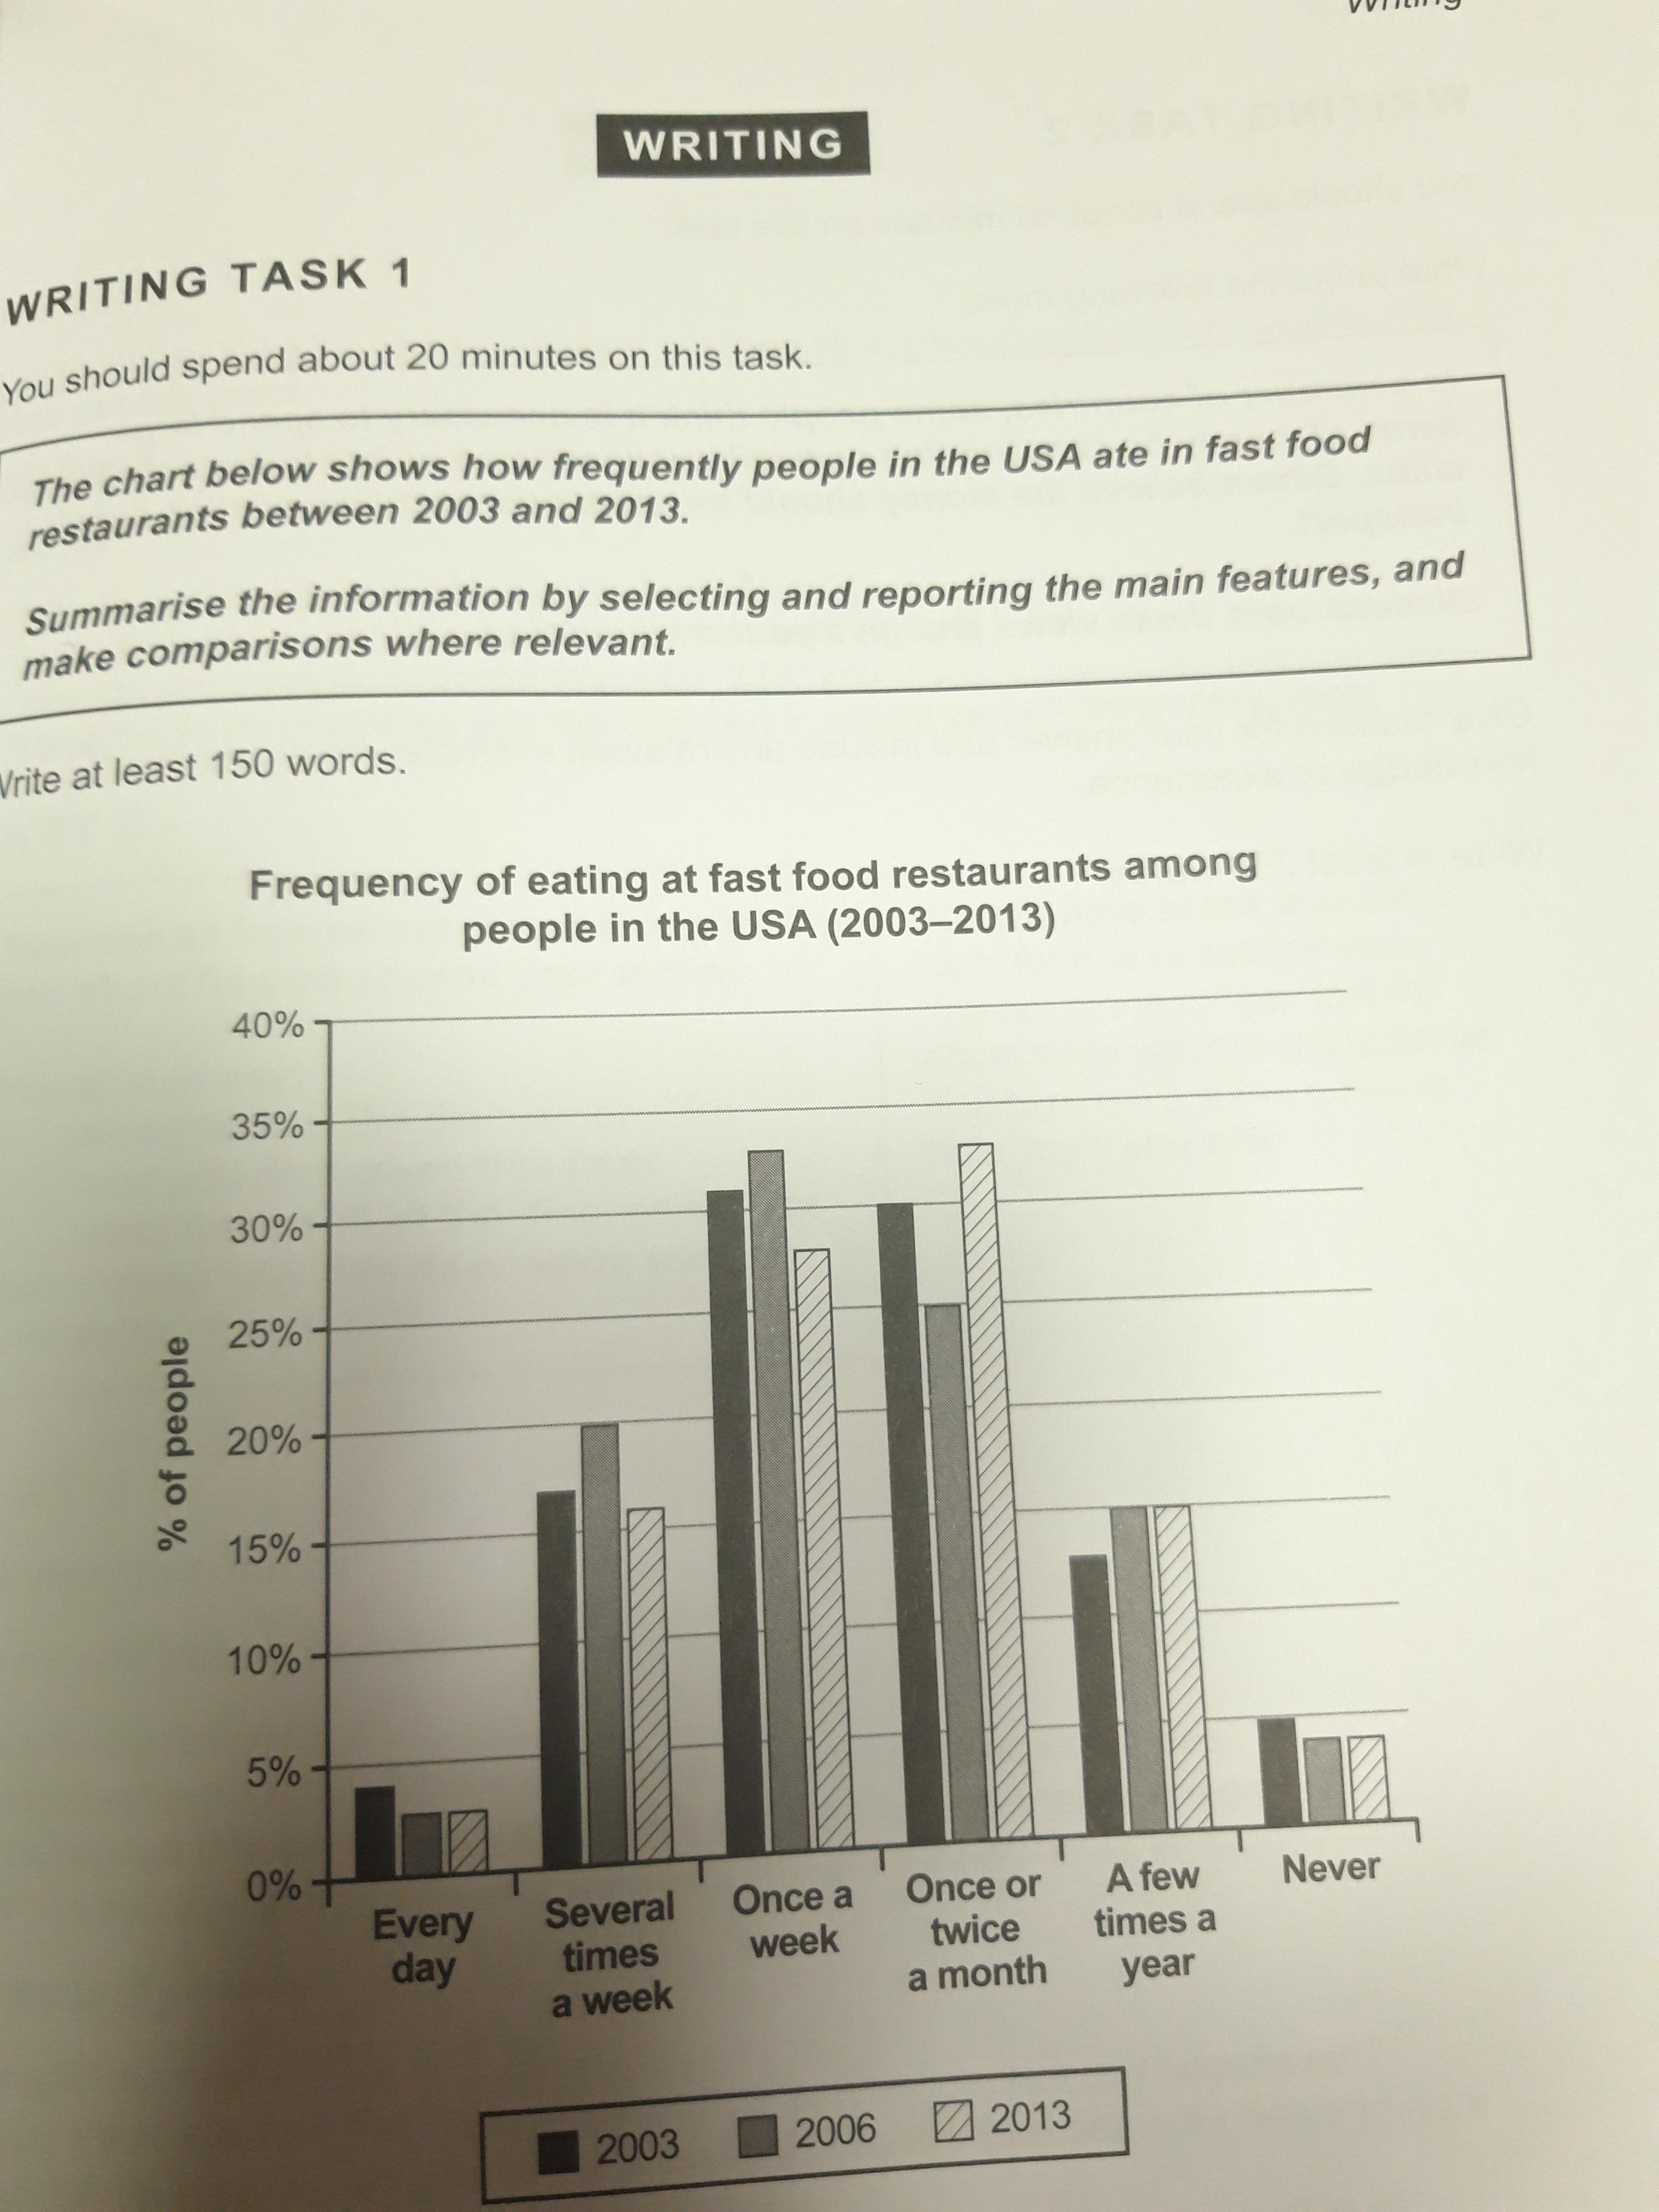
The bar chart describes the frequency of people’s eating at fast food restaurants in the USA from 2003 to 2013.
Overall, it is clear that the relatively higher figures of people who went the fast restaurants were ‘Once a week’ and ‘Once or twice a month’ during the three years. Also, one can see that the figures of ‘Every day’ and ‘Never’ had quite lowest results between those years.
To be specific, the proportion of ‘Once or twice a month’ was close behind, whilst the highest proportion of going to fast restaurants was ‘Once a week’, being over 30 percent in 2003. Furthermore, these two rankings were the same in 2006, reaching notably over 30 percent and at 25 percent respectively. However, the percentage of ‘Once or twice a month’ was much bigger than ‘Once a week’ in 2013. Lastly, the percentages of the remainders sectors were not over 20% during all three years and the remarkable features among them were ‘Several times a week’ which showed 20% only and ‘A few times a year’ which had 15% in both 2006 and 2013.
.....흐유ㅠ 이번주 토요일이 시험이에요....
죄송합니다. 제목을 기분 나쁠지도 모르게 올린것은 너무 생각이 짧았던 것 같아요.
정말 죄송합니다. 방금 확인하자마자 바로 제목 수정해서 지금 글 올려요.

 댓글 0개
댓글 0개


 불편사항 신고