


 인쇄
인쇄


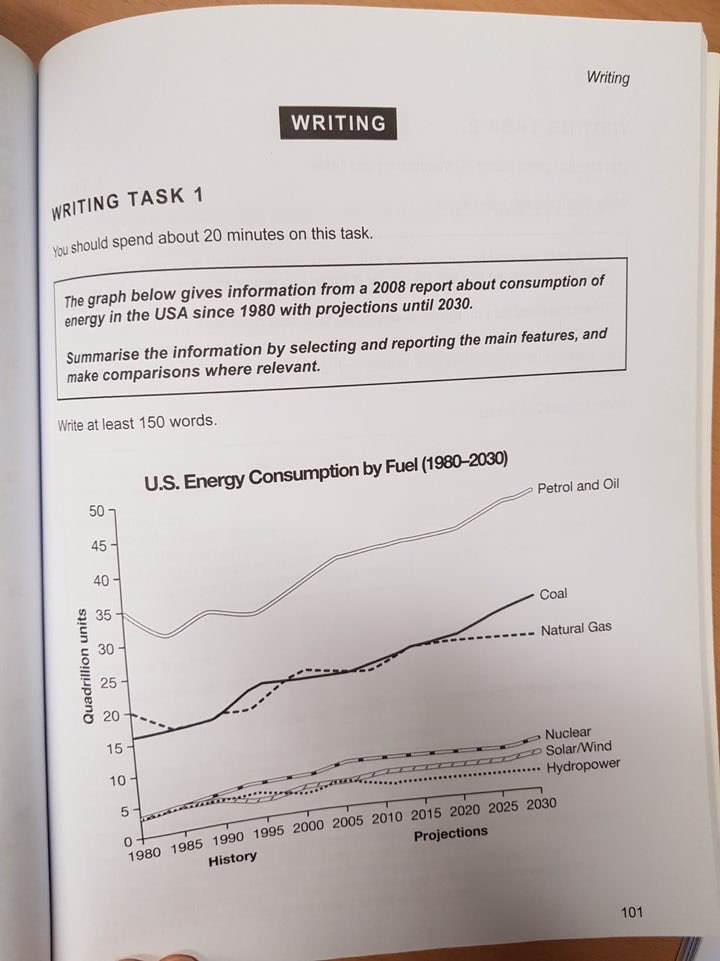
The bar chart describes that energy uses by several kinds of fuel in the USA between 1980 and 2030. At the beginning of the period, petrol and oil was the most popular fuel. The initial amount consumed was around 35 quadrillion in 1980 and it was the highest consumption among other fuels. Even though, it decreased slightly the year of 1985 and 1995, the use of petrol and oil gradually increased from the year of 1995 to the 2008 and expected to rise between 2008 and 2030. In terms of coal and natural gas, they have similar trends of consumption about 15-30 quadrillion entire period, however, there was a slight decrease for natural gas in 1985 not like coal has constant rise during the period. Aside from this figure, there were and will be energy use by nuclear, solar/wind and hydropower even if it is not that noticeable. The consumption of these three parts is only about 3-7 quadrillion and they started almost same figure from 1980 to 1990.
Overall, it is seen that petrol and oil is accounting for the biggest part of energy consumption.

 댓글 0개
댓글 0개


 불편사항 신고