


 인쇄
인쇄


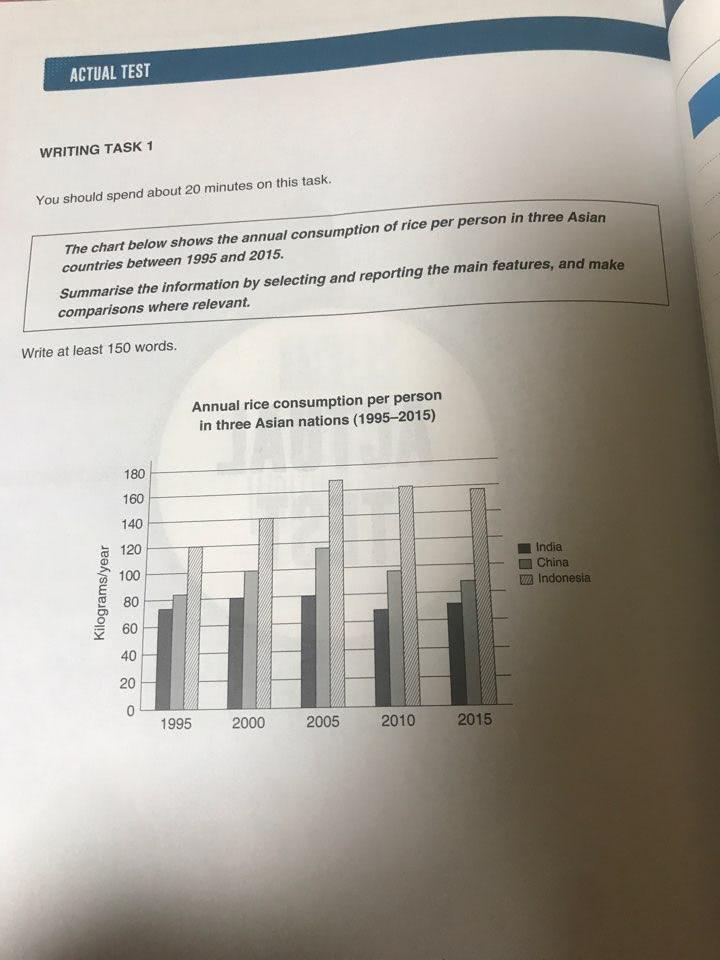
The bar graph shows that the annual rice consumption of each person in India, china (대문자 시작해주셔야합니다.), Indonesia. (서론에서 기간, 즉 1995 부터 2015까지도 같이 표현해주셔야합니다.)
Overall, the number of consumption of rice steadily rose until 2005 but it decreased afterwards 2005. Also, Indonesia had the most amount of rice consumption, followed by China and India China was second, and India is third.
As the bar graph shows, one can see that the figure of Indonesia was 120 kilograms (단위는 타협 불가입니다. 다른데에도 싹 넣어주세요~) in the first year, and it peaked as more than 160 in 2005 and it fell under 160 over the decade. As for the amount of China, it was more than 80 kilograms ~~~~~ China was more than 80 in 1995, and it increased to less than 120, decreased the amount of similar to its in 1995. The figure of India was around 70 and it rose a little and showed the same number in 2000 and 2005. It dropped under the number of in 1995, but it increased again as similar in 1995. In 1995 and 2005, the number of consumption in India was less doubled the number of Indonesia, but from 2005 to 2015, the number of consumption of Indonesia was more than double of that doubled this in India.
총평: (6/5/5/5) 5.5
지금 제일 중요한 것은 문법+어휘입니다. 몇 점을 목표하시는지에 따라 어느정도로 이를 공부해야하는지만 달라질 뿐이지, 문법과 어휘가 아직 완벽하게 갖춰져있지 않은 것은 확실하기 때문에 꼭 문법 보완을 최우선 과제로 삼아주세요~매일매일 꾸준히 해주셔야합니다.
또한 아직 task 1 요령에 있어 완벽하지는 않은 상황이므로, 링크를 하나 넣어드릴테니 꼭 정독해주시고, 혹시 아직 시험까지 조금 여유가 있으시면 당분간은 task 2부터 하는 걸 추천드립니다. 수고하셨습니다 :)
https://www.gohackers.com/?c=ielts/ielts_info2/ielts_writing&type=url&uid=461474undefined

 비밀번호 확인
 댓글 0개
댓글 0개


 불편사항 신고