


 인쇄
인쇄


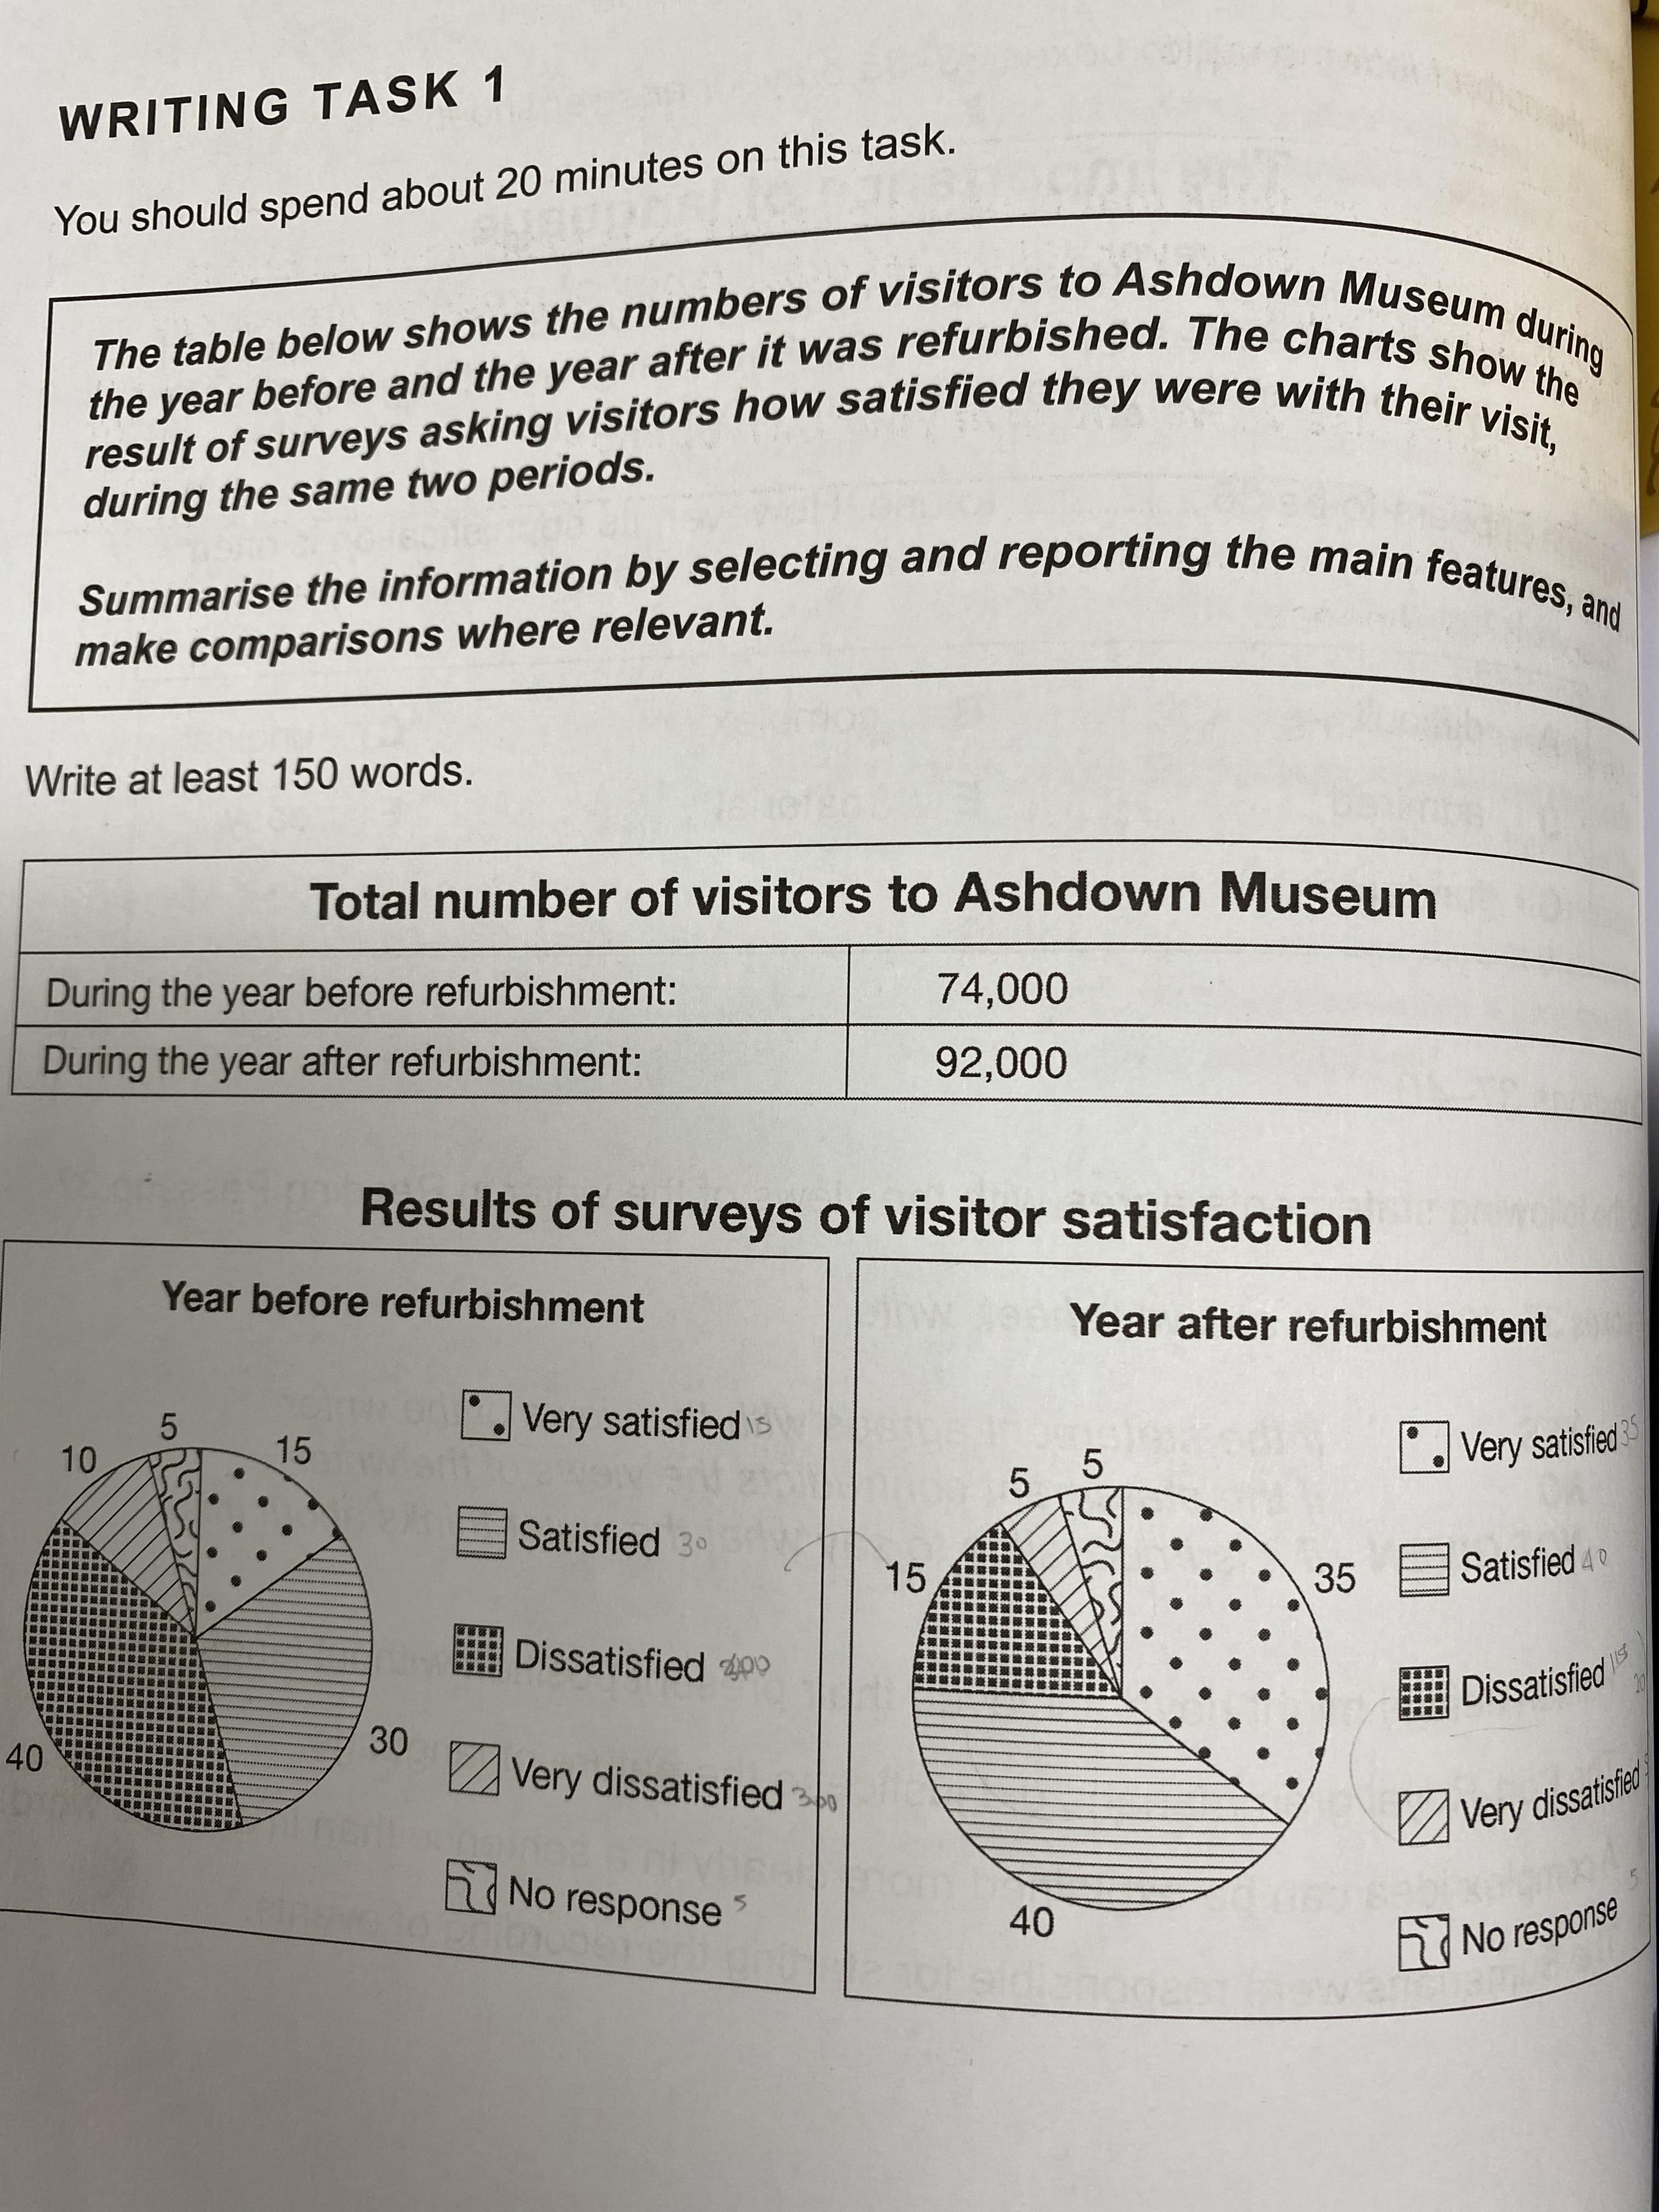
The table shows the numbers of visitors to Ashdown museum during the year before and the year after it was refurbished. And the pie charts illustrate the results of visitors satisfaction. Overall during the period, after renovated dissatisfactory opinions reduced drastically. In contrast, the visitor's satisfaction increased.
It is clearly seen from that the visitor's who answered dissatisfied declined threefold from before refurbishment to after refurbishment. Also very dissatisfied section decreased twice.
On the other hand, visitors who answered satisfied section showed highly increasing inclination. The result of very satisfied increased more than twice before renovation. And respondents who satisfied their visit had showed stable increasing. In addition the total number of visitors had increased after refurbishment. After renovate the amount of visitors to the museum increased almost twofold.
It is noteworthy that people who didn't response sustain same amount during the period.
(143자)

 댓글 0개
댓글 0개


 불편사항 신고